The UK Police API is an incredible resource for open data, but getting that data into a usable format for mapping requires a bit of "Alteryx magic." To map crimes within a specific radius, we need to move beyond simple data cleaning and into the world of API requests and JSON parse tools. Today, I’ll show you how to build a workflow that fetches crime data from a 1 mile radius around a longitude and latitude and then plots the location of those crimes on a map within Alteryx.
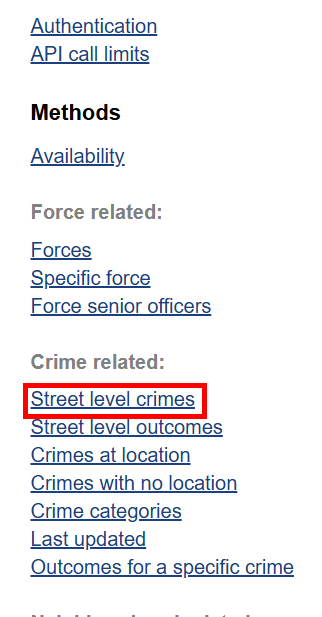
The link above takes you to the API from Data.Police.UK. This is the API we will be using in this example. From this website we are specifically looking for the "street level crimes" API.
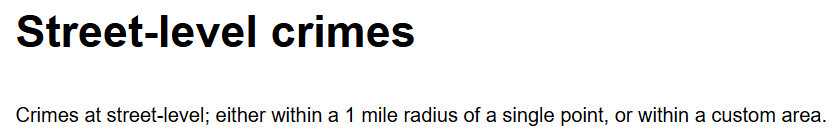
Reading through the documentation, we can see that if we input a specific point (longitude and latitude) it will return the crimes in a 1 mile radius.
Now that we know what this API is able to return us, we can look at an example request to see how we need to structure the API call in order to get the response we are looking for.
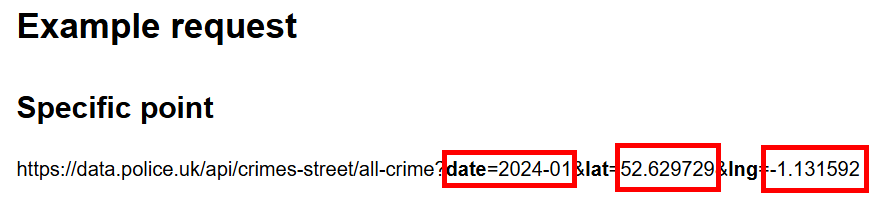
Looking at a example request for a specific point we can see that the values that we need to change here are the:
- Date
- Longitude
- Latitude
The date we are going to use in this example is October 2025 and the location will be St Paul's Cathedral in London.
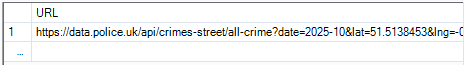
This means that our URL will look like:
https://data.police.uk/api/crimes-street/all-crime?date=2025-10&lat=51.5138453&lng=-0.0983506
we can then type this URL into google to check that it is working.
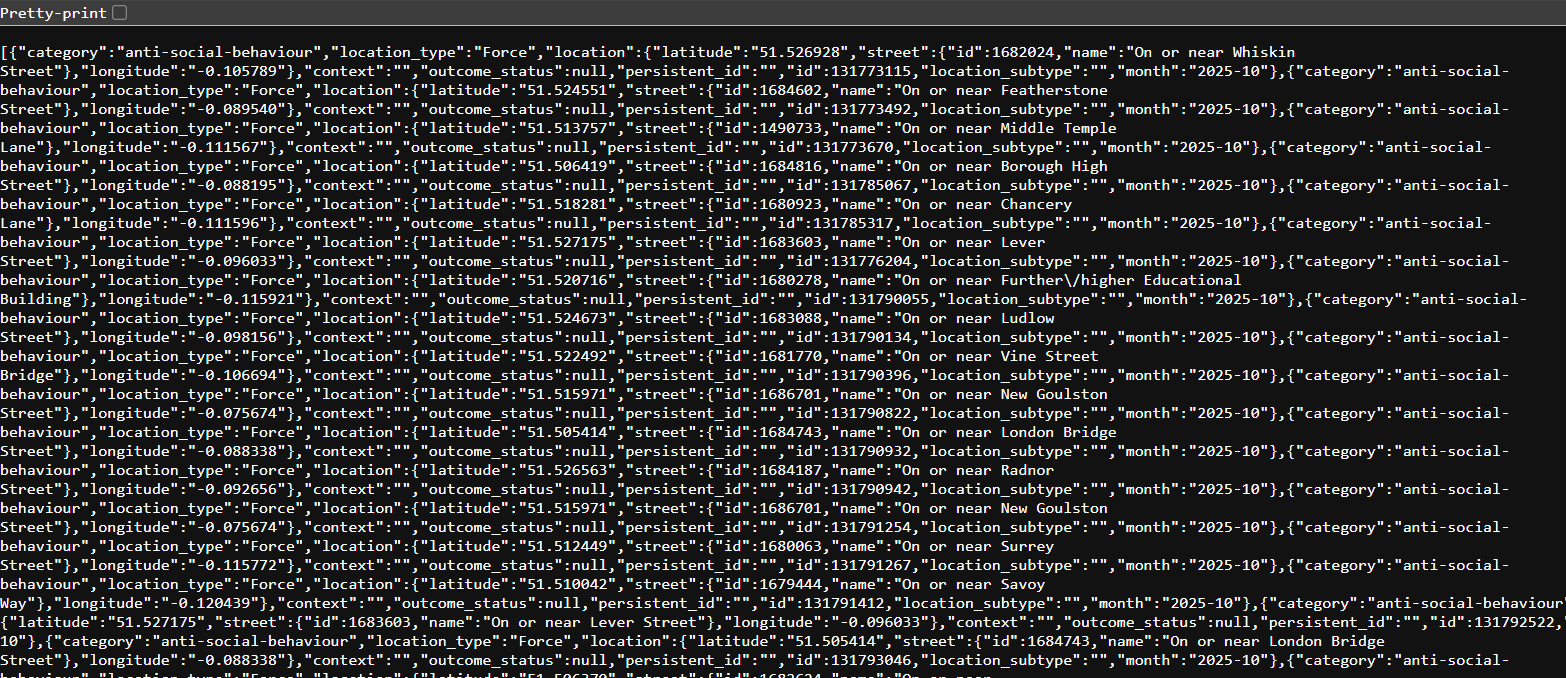
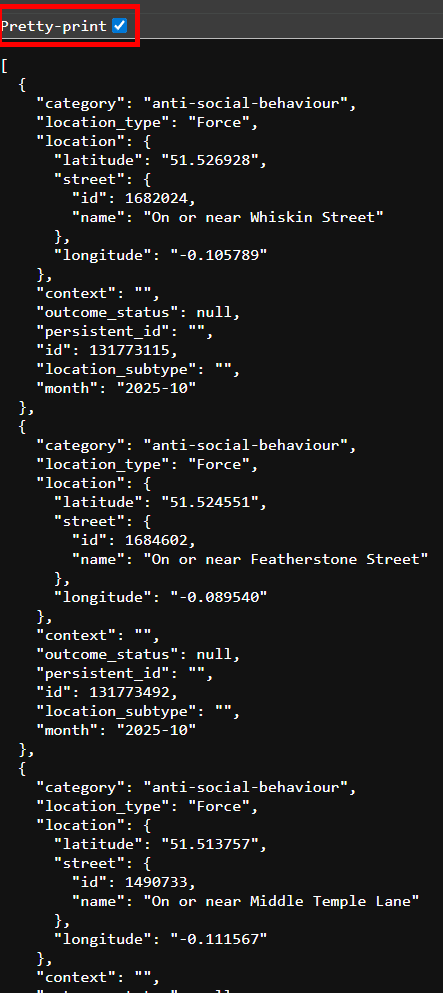
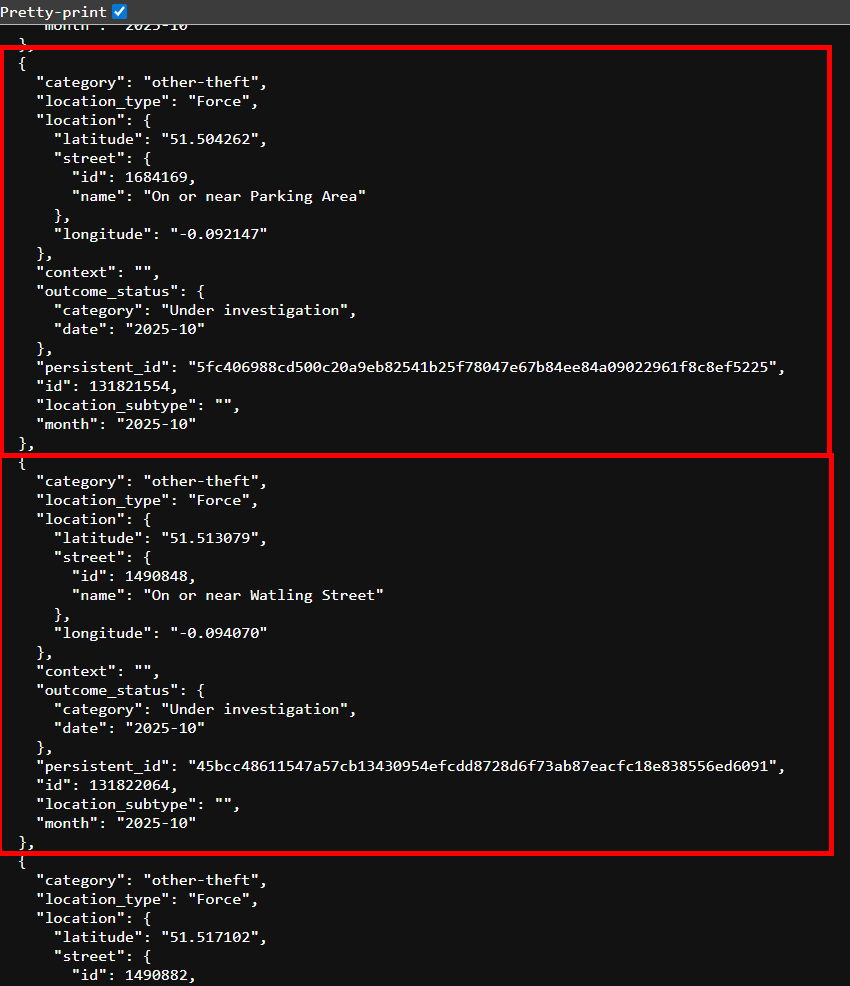
We can see that it is working as intended and hasn't returned an error message. However, the data is very hard to interpret in this format. We can click on the "pretty Print" check box in the top left to put the data into a more readable format.
The next step is to bring this into Alteryx.
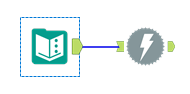
In order to get the information from the URL, it is the same process used for web scraping. You put the URL into a text input tool and then connect that to a download tool.
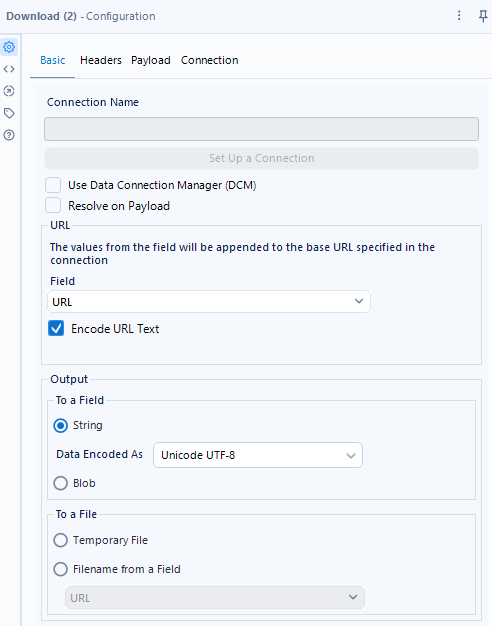
I suggest right clicking on the download tool and selecting cache and run. This runs the download tool and everything before it and then saves that output. It allows you to run the flow as many times as you need to after that without having to call the API every time. It allows you to work at a much faster pace as you don't have to keep waiting for the download tool to work every time you run the flow, and it ensures you are not putting stress on the API by calling it too many times.
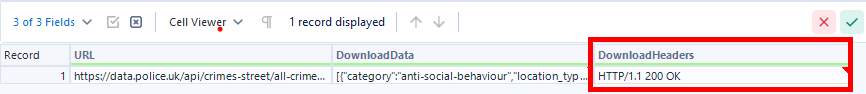
After selecting cache and run, we can see that the download tool was successful by looking at its output.
We now need to determine what data we want to extract from the API and where to get that information from.
Looking at the pretty print of the JSON data we can see that each section in red is a different crime. We can see all of the details we need to extract within the data for each crime.
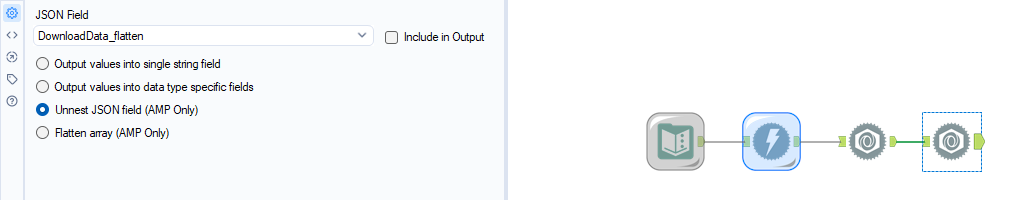
Now that we know what we want, we can start using the JSON parse tool to parse that data.
Configure the JSON parse tool as follows
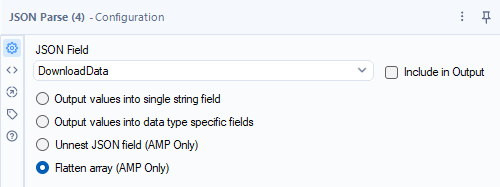
Using flatten in this case, separates the data for each crime ( the red boxes above) into separate rows.
A trick to know whether to use flatten or unnest is if the value in the field starts with a Square Bracket ( [ ) then use flatten and if it starts with a curly bracket ( { ) then use unnest.
In this case we want the crimes:
- Category
- Type
- ID
- Month
- Latitude
- Longitude
- Street Name
- Outcome Status
- Outcome Status Date
Looking at an example of the JSON data, we can see all of the data we need to extract and by looking at the locations of brackets we can determine where they are located and what method of JSON parsing to use to extract them.
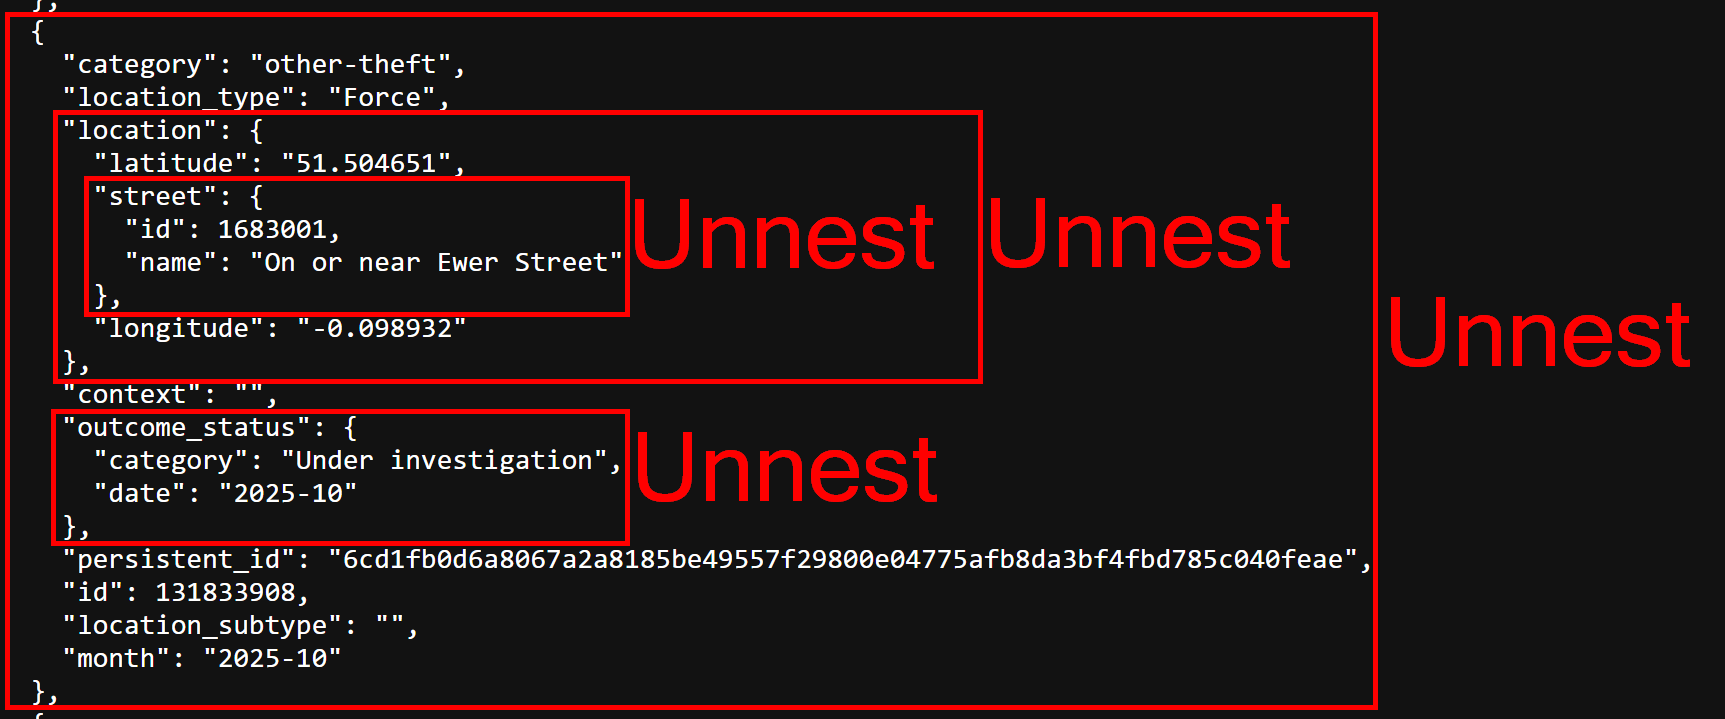
The next step is to do the outside unnest to return the data as separate fields. This will return the data which is not nested as well as the data which is still nested and requires another unnest in order to extract.
After running the flow, we are returned the:
- Category
- Location Type
- Nested Location
- Context
- Nested Outcome Status
- Persistent ID
- ID
- Location Sub Type
- Month
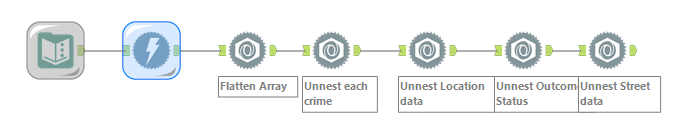
The next step is to unnest the location and outcome status. The street data is nested within the nested location data so that will also have to be unnested. It can only be unnested after the location data has been unnested as it sits within it.
Use the JSON parse tool three more times to unnest this data.
The output from this flow so far should have the following fields:
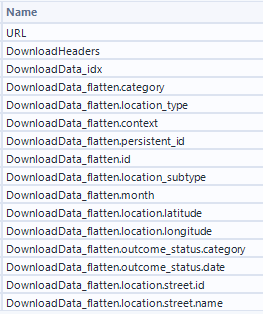
We can then use a select tool to only keep the fields we need.
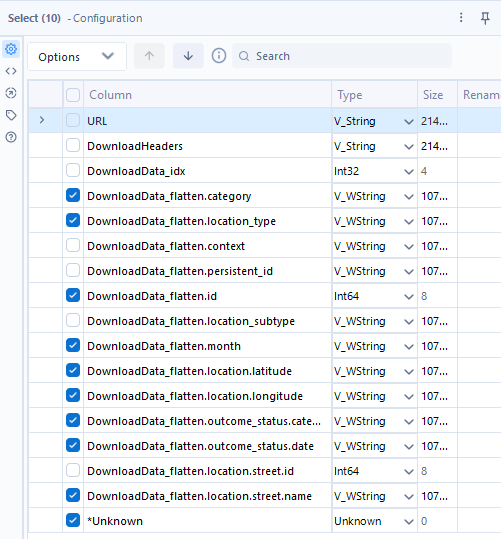
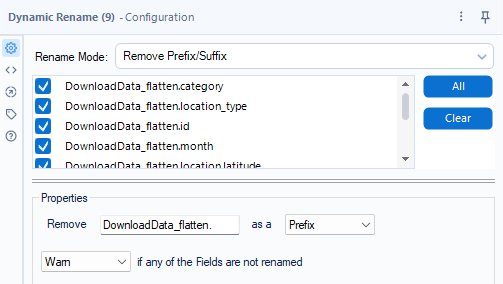
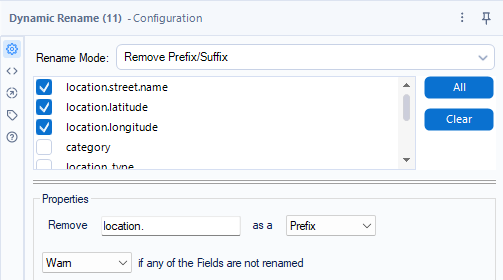
The Fields all have hard to read names, so we can use a dynamic rename tool or 2 to clean them up.
We are then left with clean data on each crime that happened within a 1 mile radius of St Paul's Cathedral in October 2025.
The next step is to then map this data within Alteryx. This is done using a "Create Points" tool and a browse tool.
Configure the create points tool as shown:
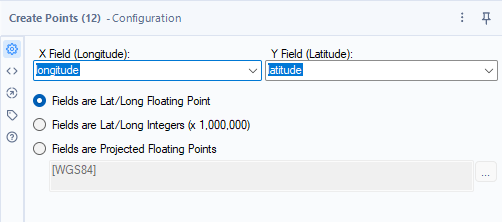
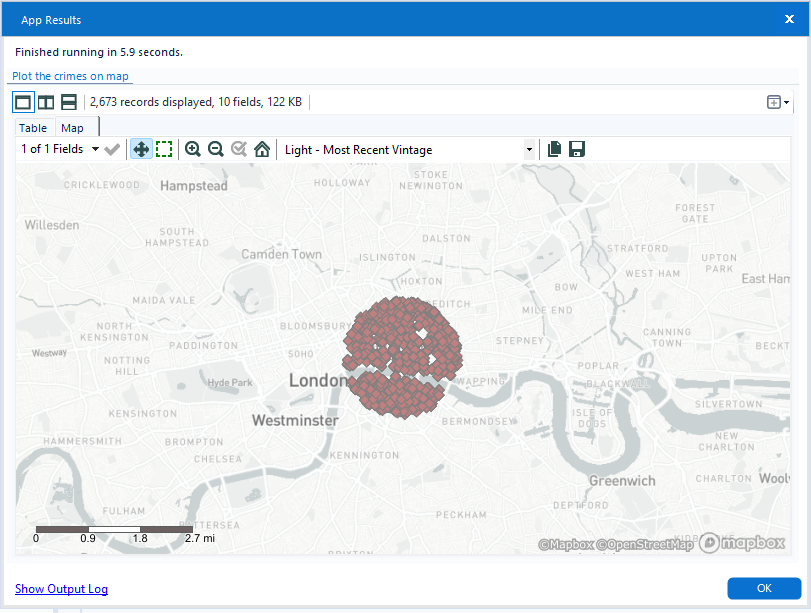
And then connect this to a browse tool. After running the flow, click on the browse tool and select "Map".
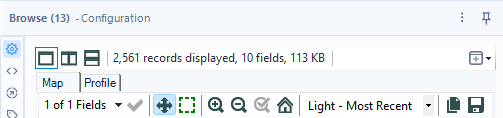
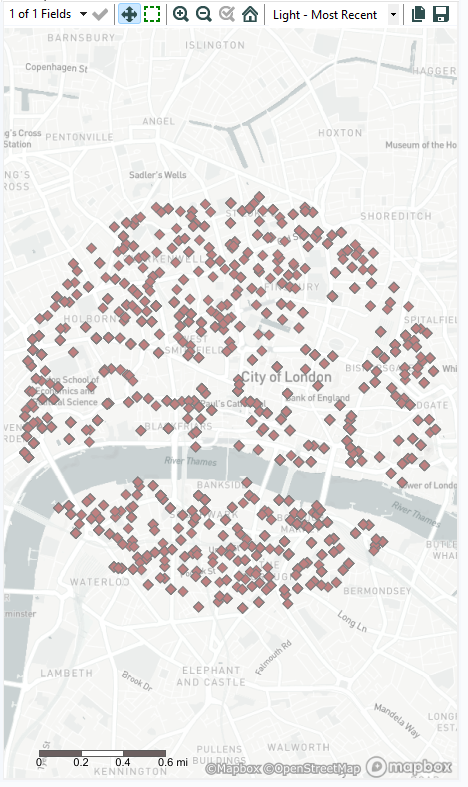
You should then see a map created showing the locations of all of the crimes around St Paul's Cathedral in October 2025.
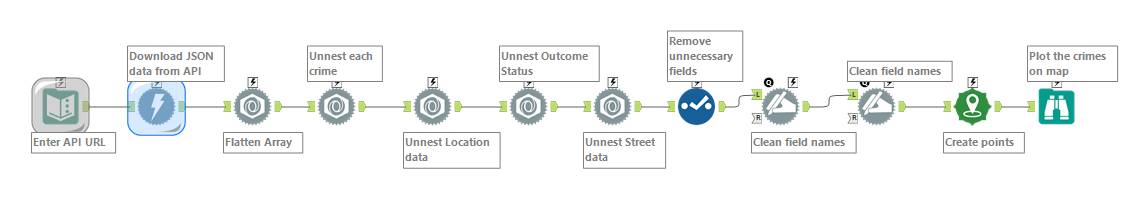
The completed flow should look as follows:
Congratulations, you have just used Alteryx to call an API, extract the data you want and then plot that data onto a map within Alteryx.
A way to make this Alteryx flow more interactive is to make it into an app. This will allow the user to determine the what date, longitude and latitude they want to view the crimes for.
Add the text box interface tool into the flow and connect it to the lightning symbol on top of the text input. An action tool will appear between the text box and text input tools
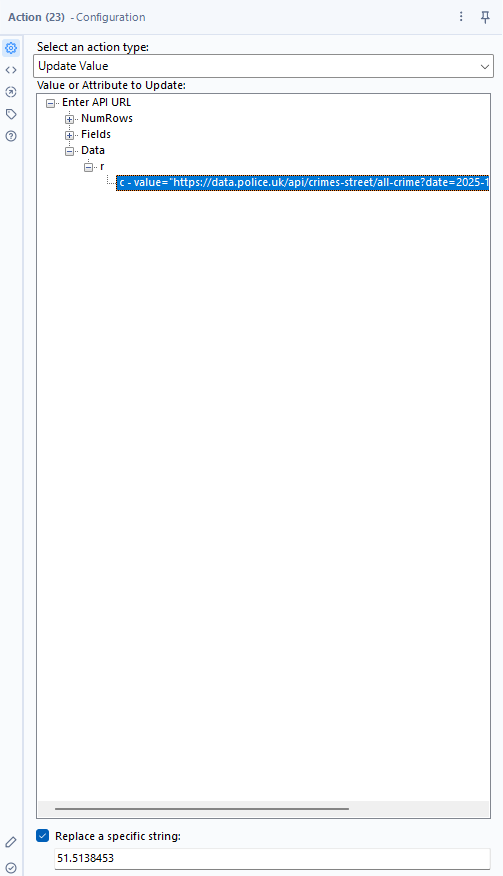
Within the action tool, ensure update value is selected, and under data click on the URL so that it is highlighted.
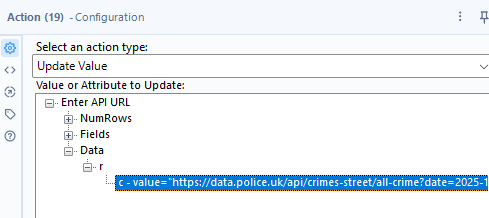
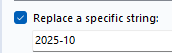
At the bottom of the interface tool configurator, there is a tick box titled "Replace a specific string". When this is selected, whatever is entered by the user of the app will replace whatever is left in the line of text below the check box.
So for the first text box interface tool, we want to allow the user to replace the date. This means we should only leave the date in the text after the tick box.
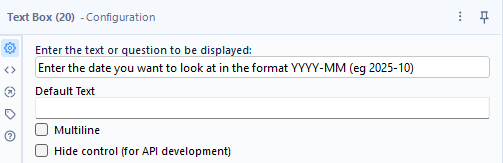
Then within the text box tool we can enter the instructions.
The process is the same for changing the latitude. We add another text box, connect it to the text input. Select update value. Click on the URL under data. Click on replace a specific string and then only leave the latitude.
Then in the text box interface tool, enter the instructions for this input.
The exact same is then done for the longitude.

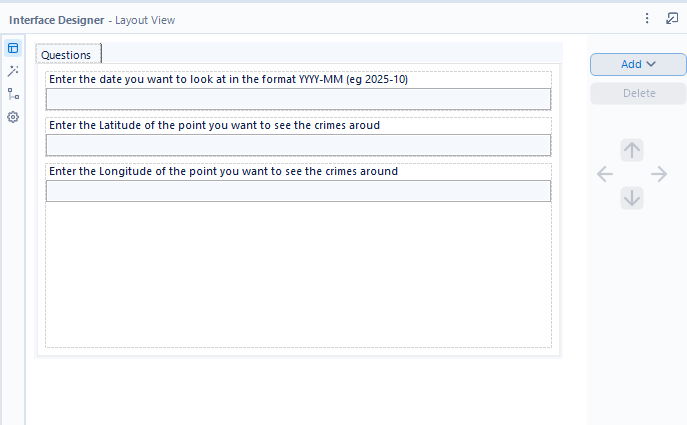
Then to make the output appear in the app, In the ribbon at the top of the Alteryx UI, select view and then interface designer.
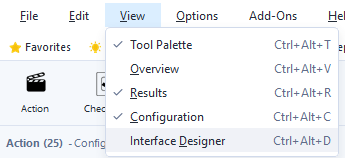
This will give you a preview of what your app interface will look like and allow you to add and make changes to the design and layout.
Within the interface designer, click on properties and select the browse tool you used to display the map.
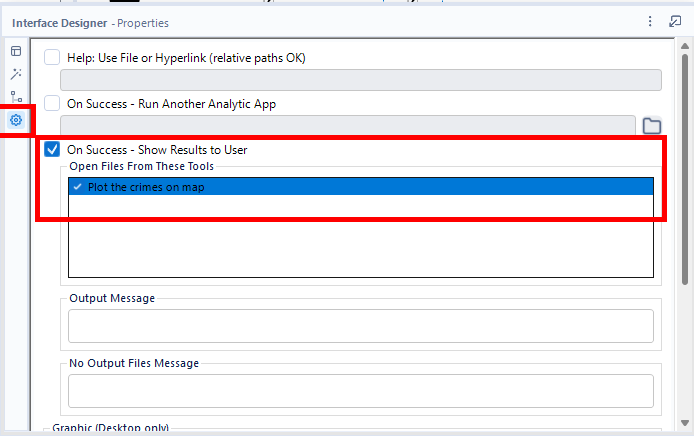
This now means that when the app is run, the user will be able to see the results and use the app.
Now we can close the interface designer and run the app by clicking the wand next to the run button.
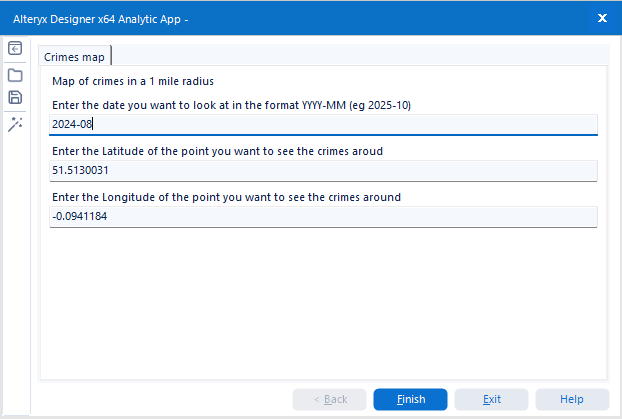
After entering a data and a longitude and latitude the app produces a map of the crimes.