


Born in Scotland in 1759, William Playfair is credited with inventing the bar chart, the pie chart, the line chart, and the area chart. In the 200 years since his death the field of statistical graphics has grown exponentially, but our use of visualizations has hardly departed from his original template.

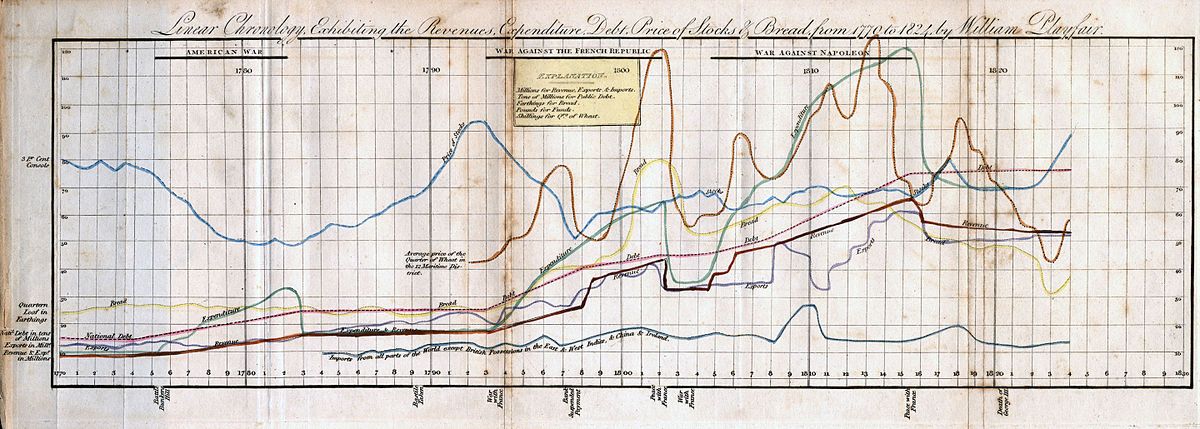
Playfair led an interesting and varied life, although he seemed to get himself into trouble in many circumstances. In his early life he worked as a draftsman, a silversmith, and inventor. Living in France at the time, he took part in the storming of the Bastille, although he would leave France a few years later after a failed emigration scheme. For much of his life he earned his living as an essayist and editor; his writings often had a patriotic character and in his publications he pioneered the use of statistical graphics to make his points. Much inspired by Joseph Priestley's chronological line graphics, he arranged lines to chart economic data.
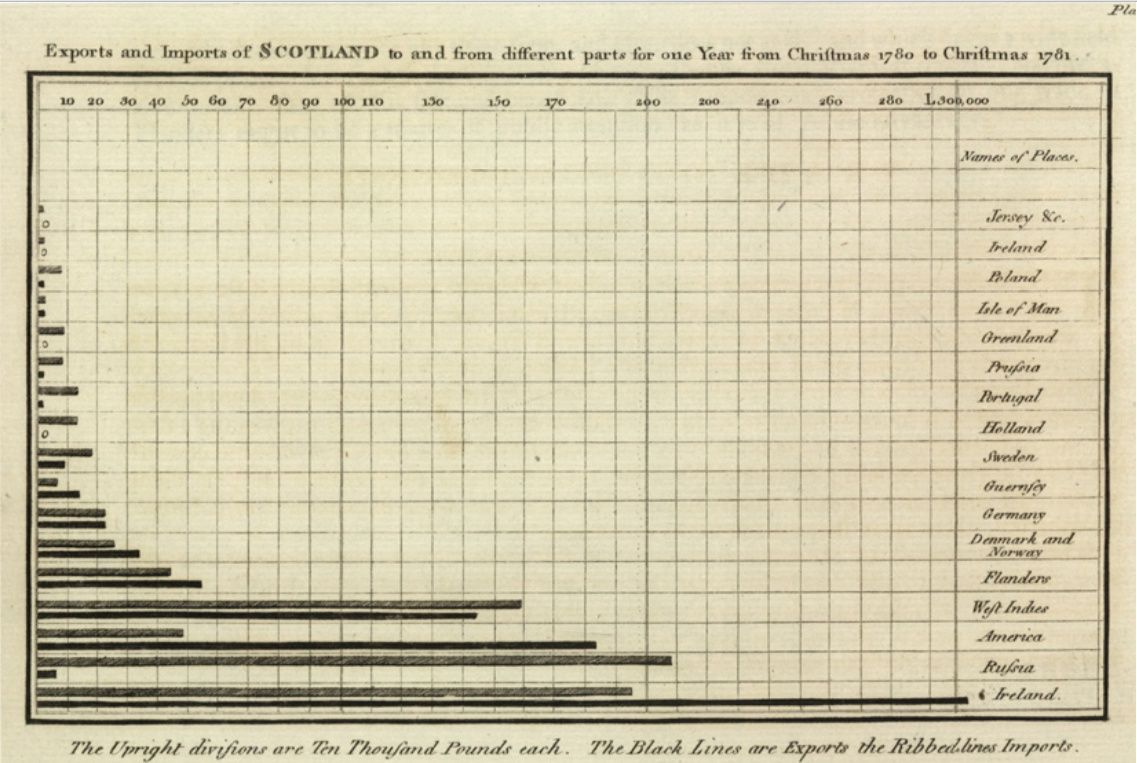
The invention of the bar chart came as a sort of accident. Whereas Playfair would normally make line graphs that followed different countries' fates over time, in this case he only had data for a single year, and so made this chart on Scotland's imports and exports with various trading partners.
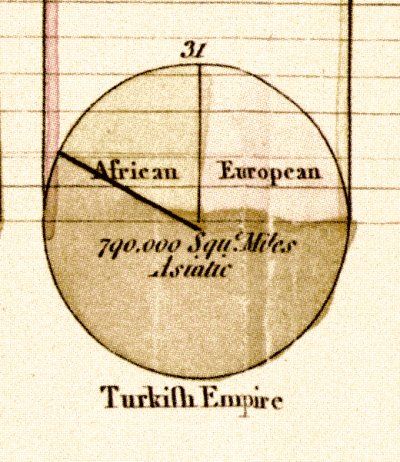
He also created the pie chart seemingly from whole cloth, in this case showing the extent of the Turkish Empire at the time.

It is remarkable how modern his illustrations still look, which stands as a testament to Playfair's original designs. While not appreciated for his contributions during his lifetime, he has come to be understood as a major progenitor of data analysis and the visual display of data.