Today began with the Genius API. Genius is an app that provides lyrics and the meaning behind them, meaning they have a huge database of songs and artists. We were given a link to their API documentation and told to have a go at it. Much like the webscraping exercise we did yesterday, we would interact with this API through the Alteryx developer tools, so we all booted up Alteryx to get to work.
The difficult thing about working with this API was going to be it's utilization of OAuth2 for controlling access to the endpoints. We had to get a client access token and make sure it was included in the headers every time we sent a request. The way I got this to work was keeping this token in the request URL itself using the Formula tool to put my URL together, which was much easier than trying to manage the headers on Alteryx's Download tool's configuration pane. The search term I used was 'Talking Heads." So with this working I was able to use RegEx again along with the Crosstab tool to pull out and format the parts of the response I needed to make further requests. This was a list of songs on the platform (or at least the top 20) that I would then use to try and get the lyrics for.
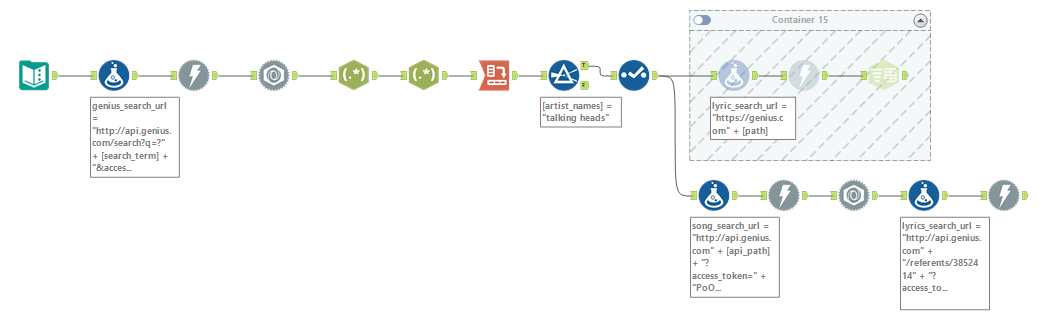
It was about this time in the morning that we found out that Genius only allows 100 API calls per month per IP address (on the free tier) and we found ourselves rate limited. I.e. we were all done using the Genius API for the day... and month. Thus, a pivot!
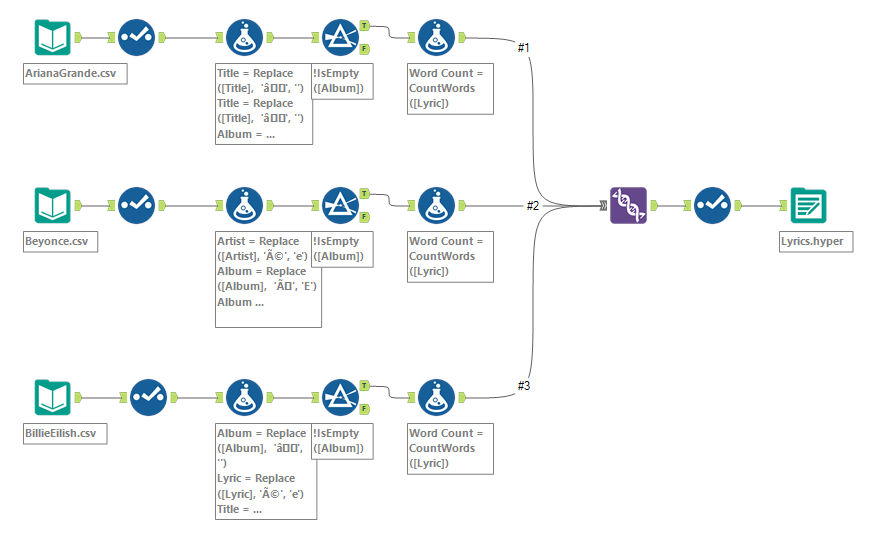
Luckily someone in our cohort was already using a separate lyrics dataset, so we all able to hop over to that instead, working with a limited set of artists but with a full set of songs and lyrics already contained in the data. The data was a little messy so it still needed a bit of cleaning up in Alteryx. I chose to work with the first three artists in the list: Ariana Grande, Beyonce, and Billie Eilish. I cleaned up what I could, got word counts for each song, and opened up Tableau to see what I could come up with.
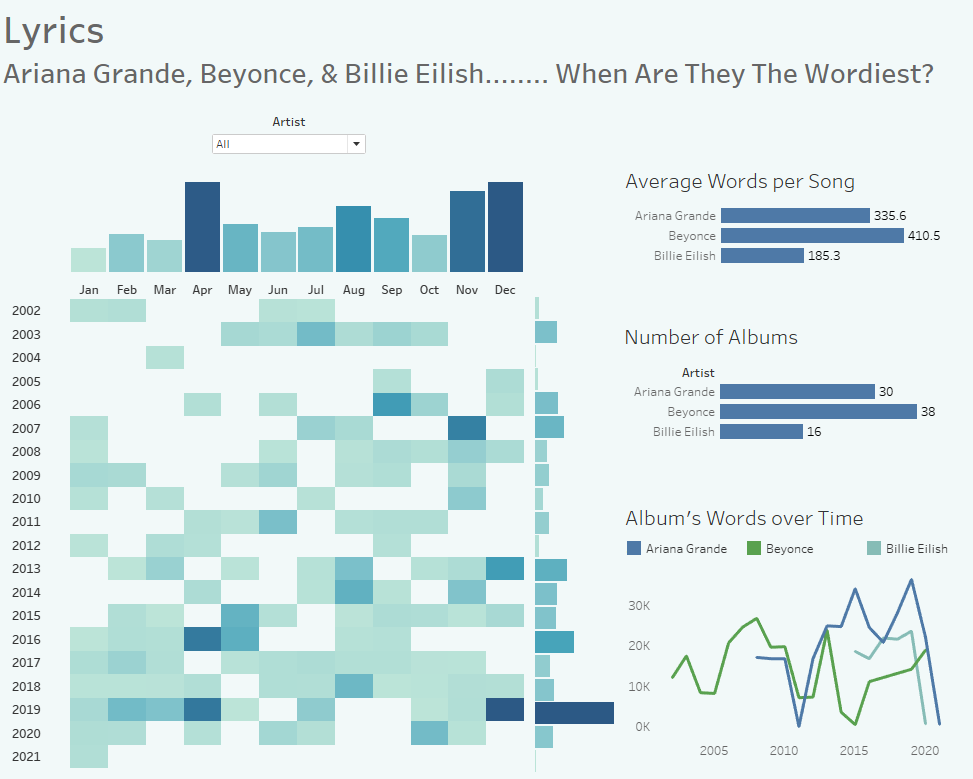
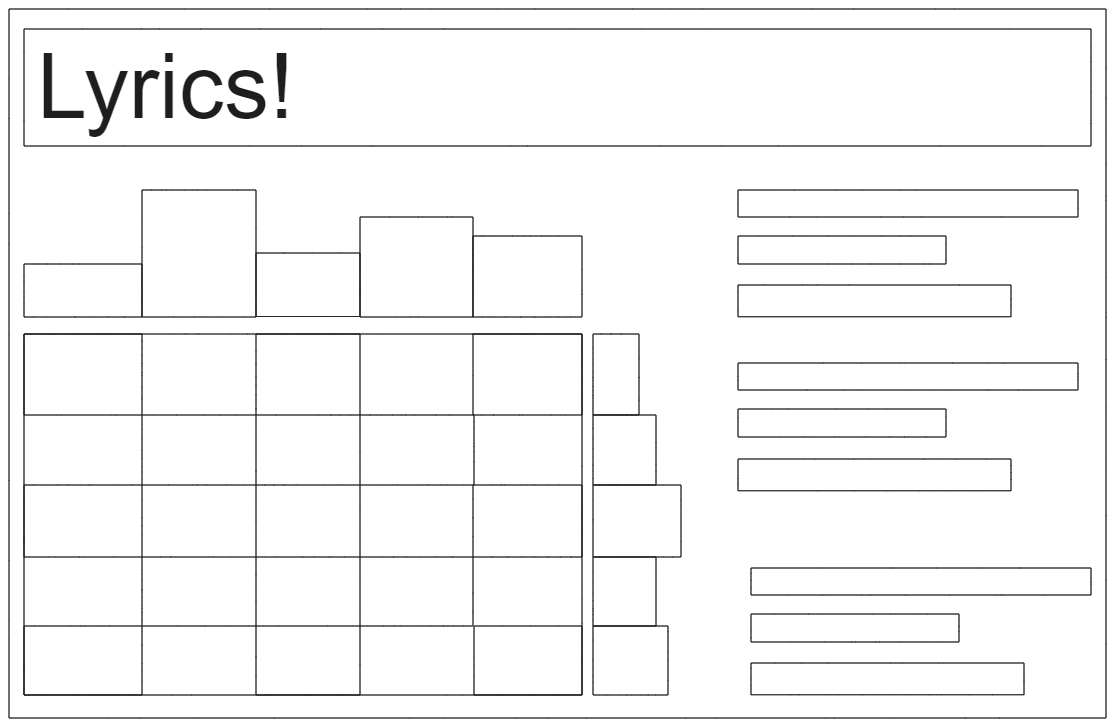
I had a rough idea of the marginal histogram I would create, and figured I would add a couple more graphs as well.
I experimented with a few different charts and graphs, and settled on ones looking at word count per song, number of albums, and words per album over time, along with my marginal histogram. Here is the finished result: