*Record Scratch* *Freeze Frame* “You’re probably wondering how I ended up with two posts in as many days.” You see, I lost a bet and a post is my forfeit (weird bet I know). The way I lost said bet however, does give rise to an interesting discussion about paying attention to small details – although my neglect didn’t have any major repercussions, in a higher stake’s scenario, it might've done.
A Royal Flop
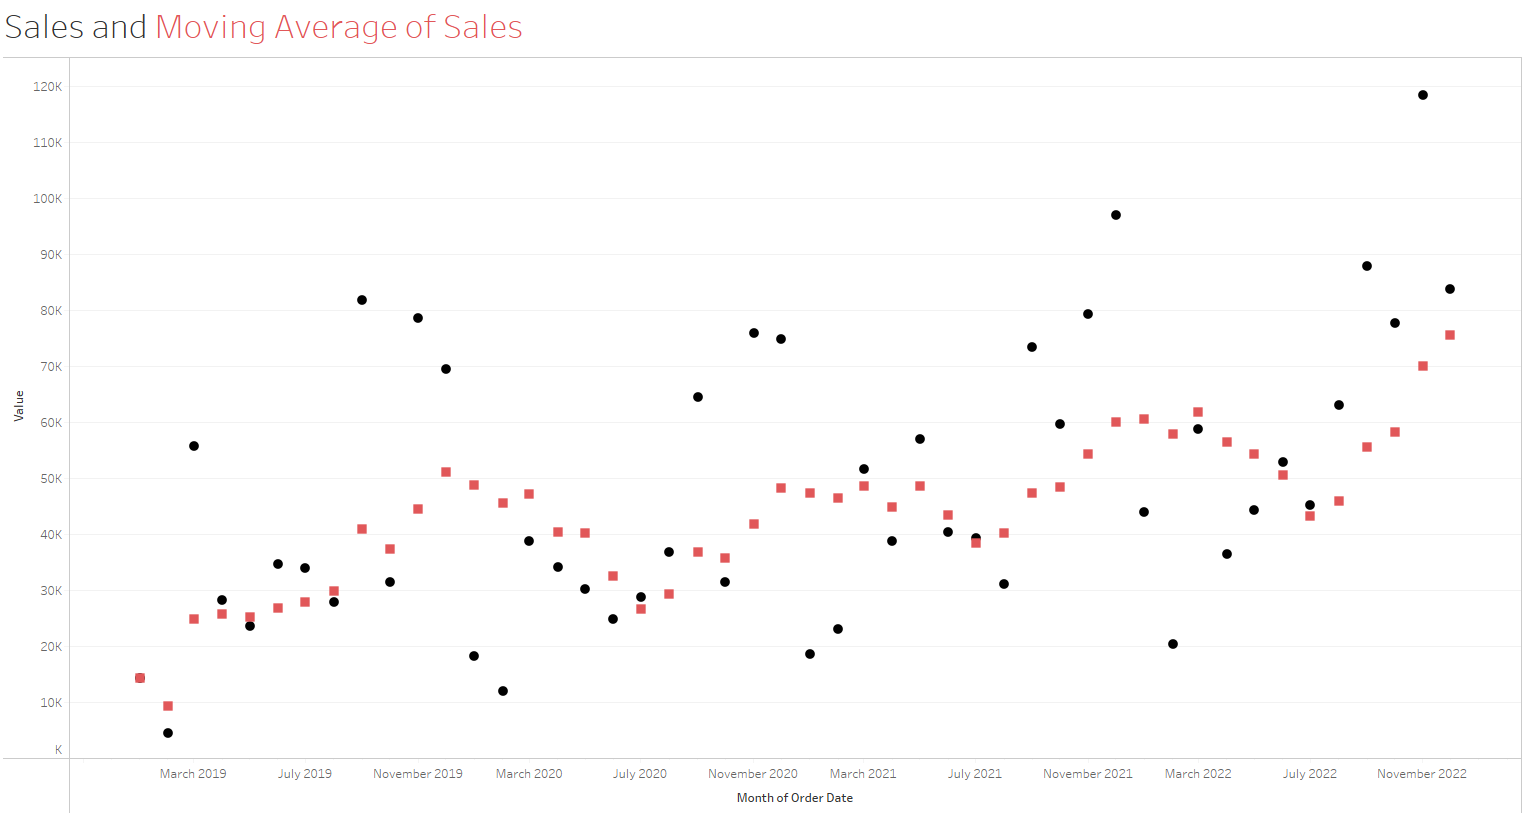
In today’s lesson about date functions, we ended up having to create two versions of the same graph – one on dual axes and one on shared. After “someone,” (definitely not me) stated that both graphs were exactly the same, our coach decided to put that to the test. The game was simple, she put up a graph and we would have to determine whether it was created using a shared or dual axes. If we got it wrong then we would have to post about something from the day, and if we got it right … well there wasn’t really anything for getting it right (in hindsight not the greatest of bets). Anyways, the graph below is a recreation of the one she made so you can give it a go as well.

So, was it built using a shared axis or a dual axis?
I’ll reveal the answer in a moment, but if you did manage to determine the axis type, then it may be time to phone Agatha Christie because that is some serious detective work. For those who are still unsure I’ll make it a bit easier.
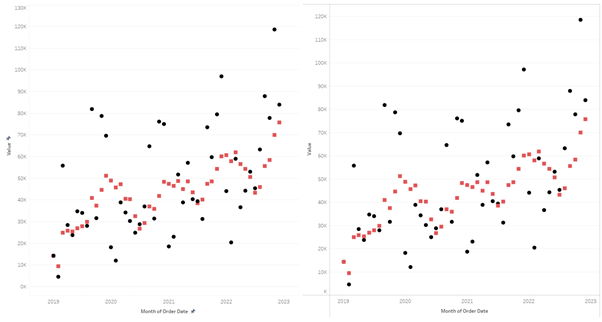
Instead of looking at one graph and trying to work out which one it is, how about I display both graphs and we play a quick game of spot the difference.

There’re a couple differences between the two (some of which are simply due to my inexperience with formatting), but we’ll focus on the difference that allows us to distinguish which graph is which. It’s the borders. Yup, the borders on the right graph mean that both it (and the one above) were created using a dual axis, whilst the one on the left was done using a shared axis.
N.B. The reason that this happens is that using a dual axis creates an axis on the right side of the graph and even when we hide said axis, tableau keeps the physical line itself whilst removing everything else.
Why does it Matter
It doesn’t, at least in this case, but like I was saying earlier a simple slip up like this could have large ramifications under different circumstances.
My old economics teacher used to say, “The Devil’s in the details,” when analysing reports. He believed that being thorough would help squeeze as much information as possible from otherwise limited reports. Whilst it is great to be thorough, it is often easier said than done. The biggest reason we tend not to be thorough is often that we simply forget (after all, checking things isn’t an inherently difficult task so long as we remember to do so).
Hopefully then, this post can act as a reminder to myself, and those reading, to be thorough. I think this is a fun, albeit silly, example and so should stick a bit better than if I was to simply say “check everything.”
