Some companies may be interested to see their YTD /QTD / MTD/ WTD (from beginning of the Year/Quarter/Month/Week until day of Today) performance in the dashboard. We could create the calculations by using the following formular:
YTD:
IF [Order Date]<=TODAY() and DATETRUNC('year',[Order Date])=DATETRUNC('year', TODAY()) then [Sales] END
//condition 1: return the date up until the latest date of [order date]
//condition 2: return the same year of the latest date
//return [sales] if the above two conditions are fulfilled
QTD:
IF [Order Date]<=TODAY() and DATETRUNC('quarter',[Order Date])=DATETRUNC('quarter', TODAY()) then [Sales] END
MTD:
IF [Order Date]<=TODAY() and DATETRUNC('month',[Order Date])=DATETRUNC('month', TODAY()) then [Sales] END
WTD:
IF [Order Date]<=TODAY() and DATETRUNC('week',[Order Date])=DATETRUNC('week', TODAY()) then [Sales] END
Note that the following calculations used the data form the sample superstore
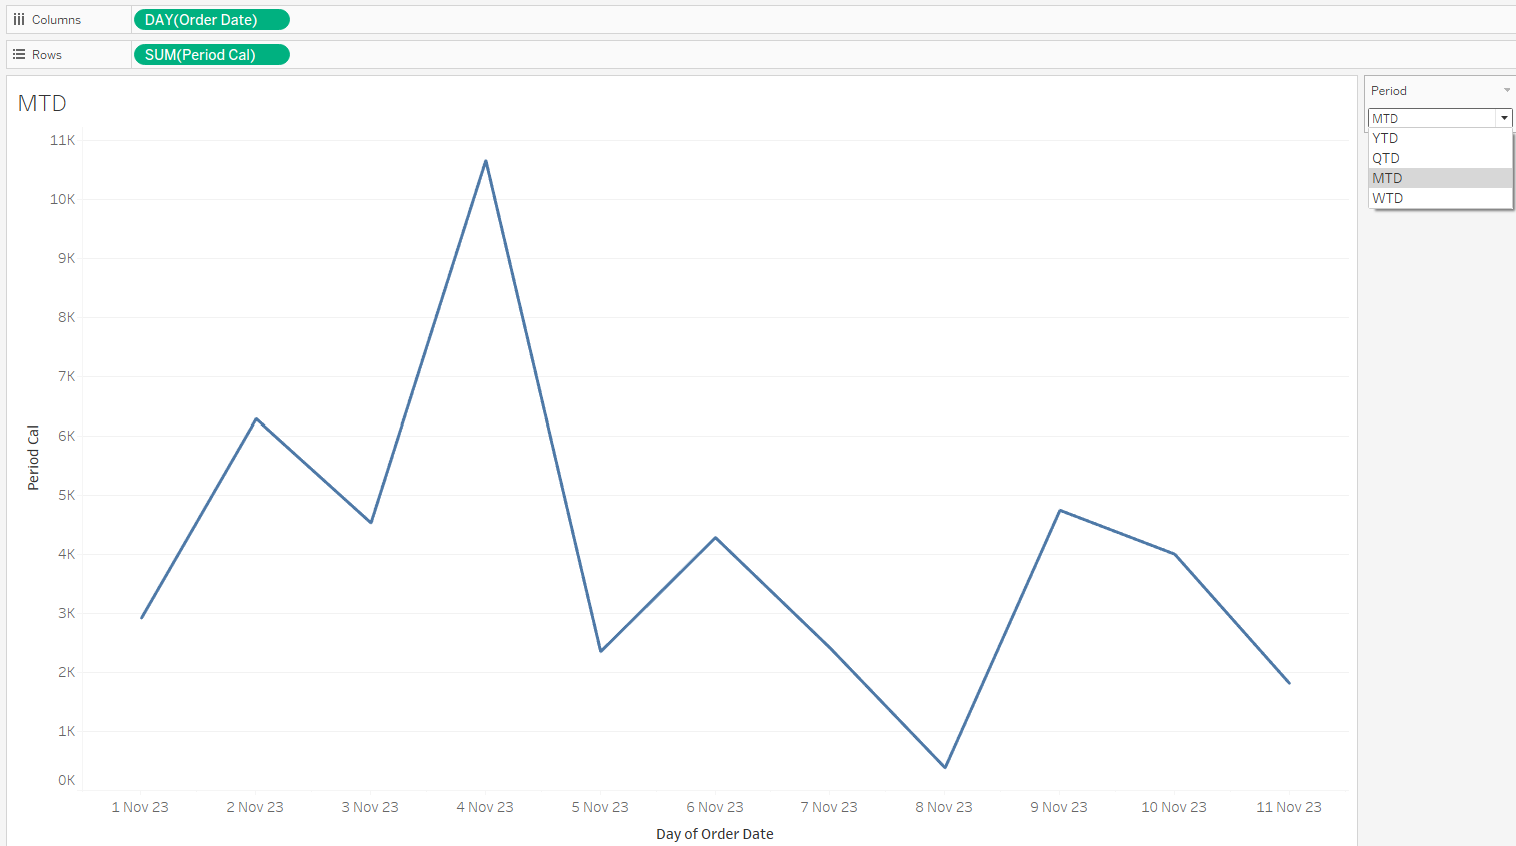
If we want to show these calculations/charts in a dynamic way using only one sheet, we can achieve it by using a parameter:
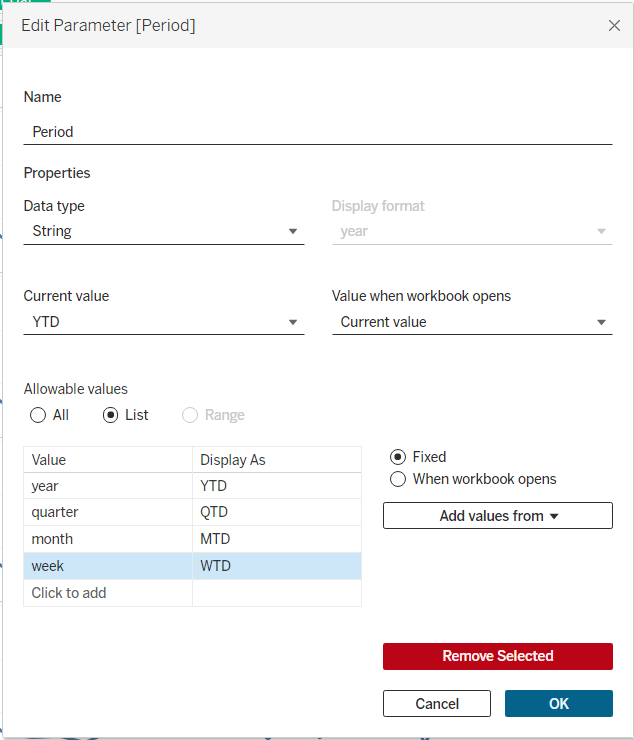
Create a parameter call Period:
Create a calculation call
Period Calculation:
IF [Order Date]<=TODAY() and DATETRUNC([Period],[Order Date])=DATETRUNC([Period], TODAY()) then [Sales] END
// as the date part have been replaced by the parameter , we are able to control which date part is applied in the computation.