


In my previous post, we have gone through on how to show YTD/QTD/MTD/WTD using one sheet.
If you are not sure, please go to this link: How to make YTD / QTD / MTD / WTD dynamic?
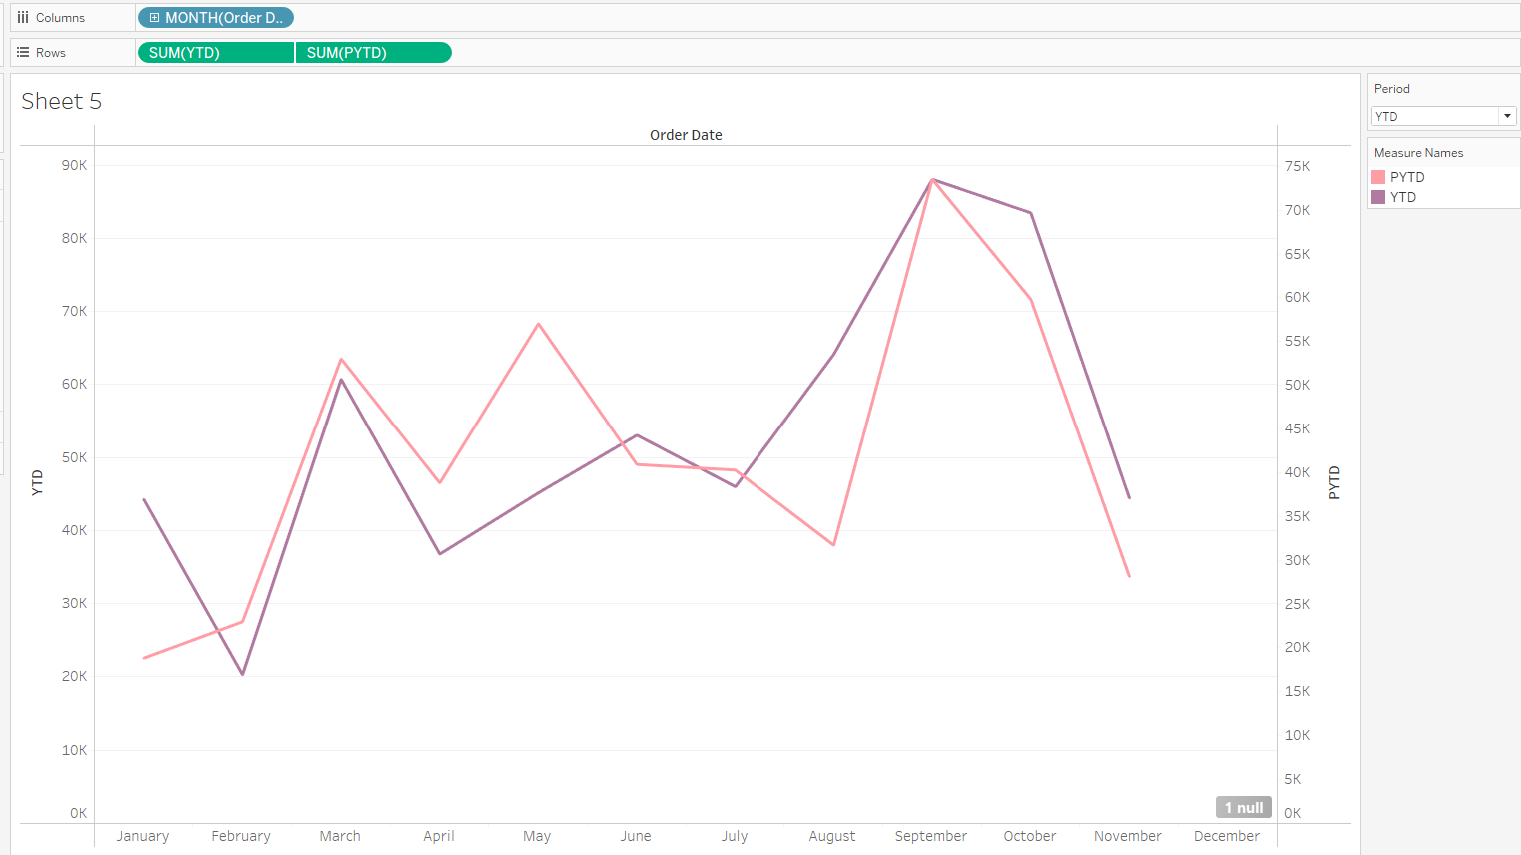
This time, we want to show YTD and Prior YTD on a line chart.
To calculation current YTD:
IF [Order Date]<=TODAY()
AND
DATETRUNC('year',[Order Date])=DATETRUNC('year', TODAY())
THEN [Sales] END
To calculation prior YTD:
IF DATETRUNC('year',[Order Date])
=DATETRUNC('year', DATEADD('year',-1,TODAY()))
AND
[Order Date]<= DATEADD('year',-1,(TODAY()))
THEN [Sales]
END
//condition 1: if the year of the [Order Date] is the same as the year of today's date minus one year
//condition 2: return the date in [Order Date], that are smaller or equal to today's date minus one year
Where these calculations, we are now be able to build a dual line chart comparing YTD and PYTD.
Which the same formular, can also be able to create PQTD/PMTD/PWTD by replacing the date part.