


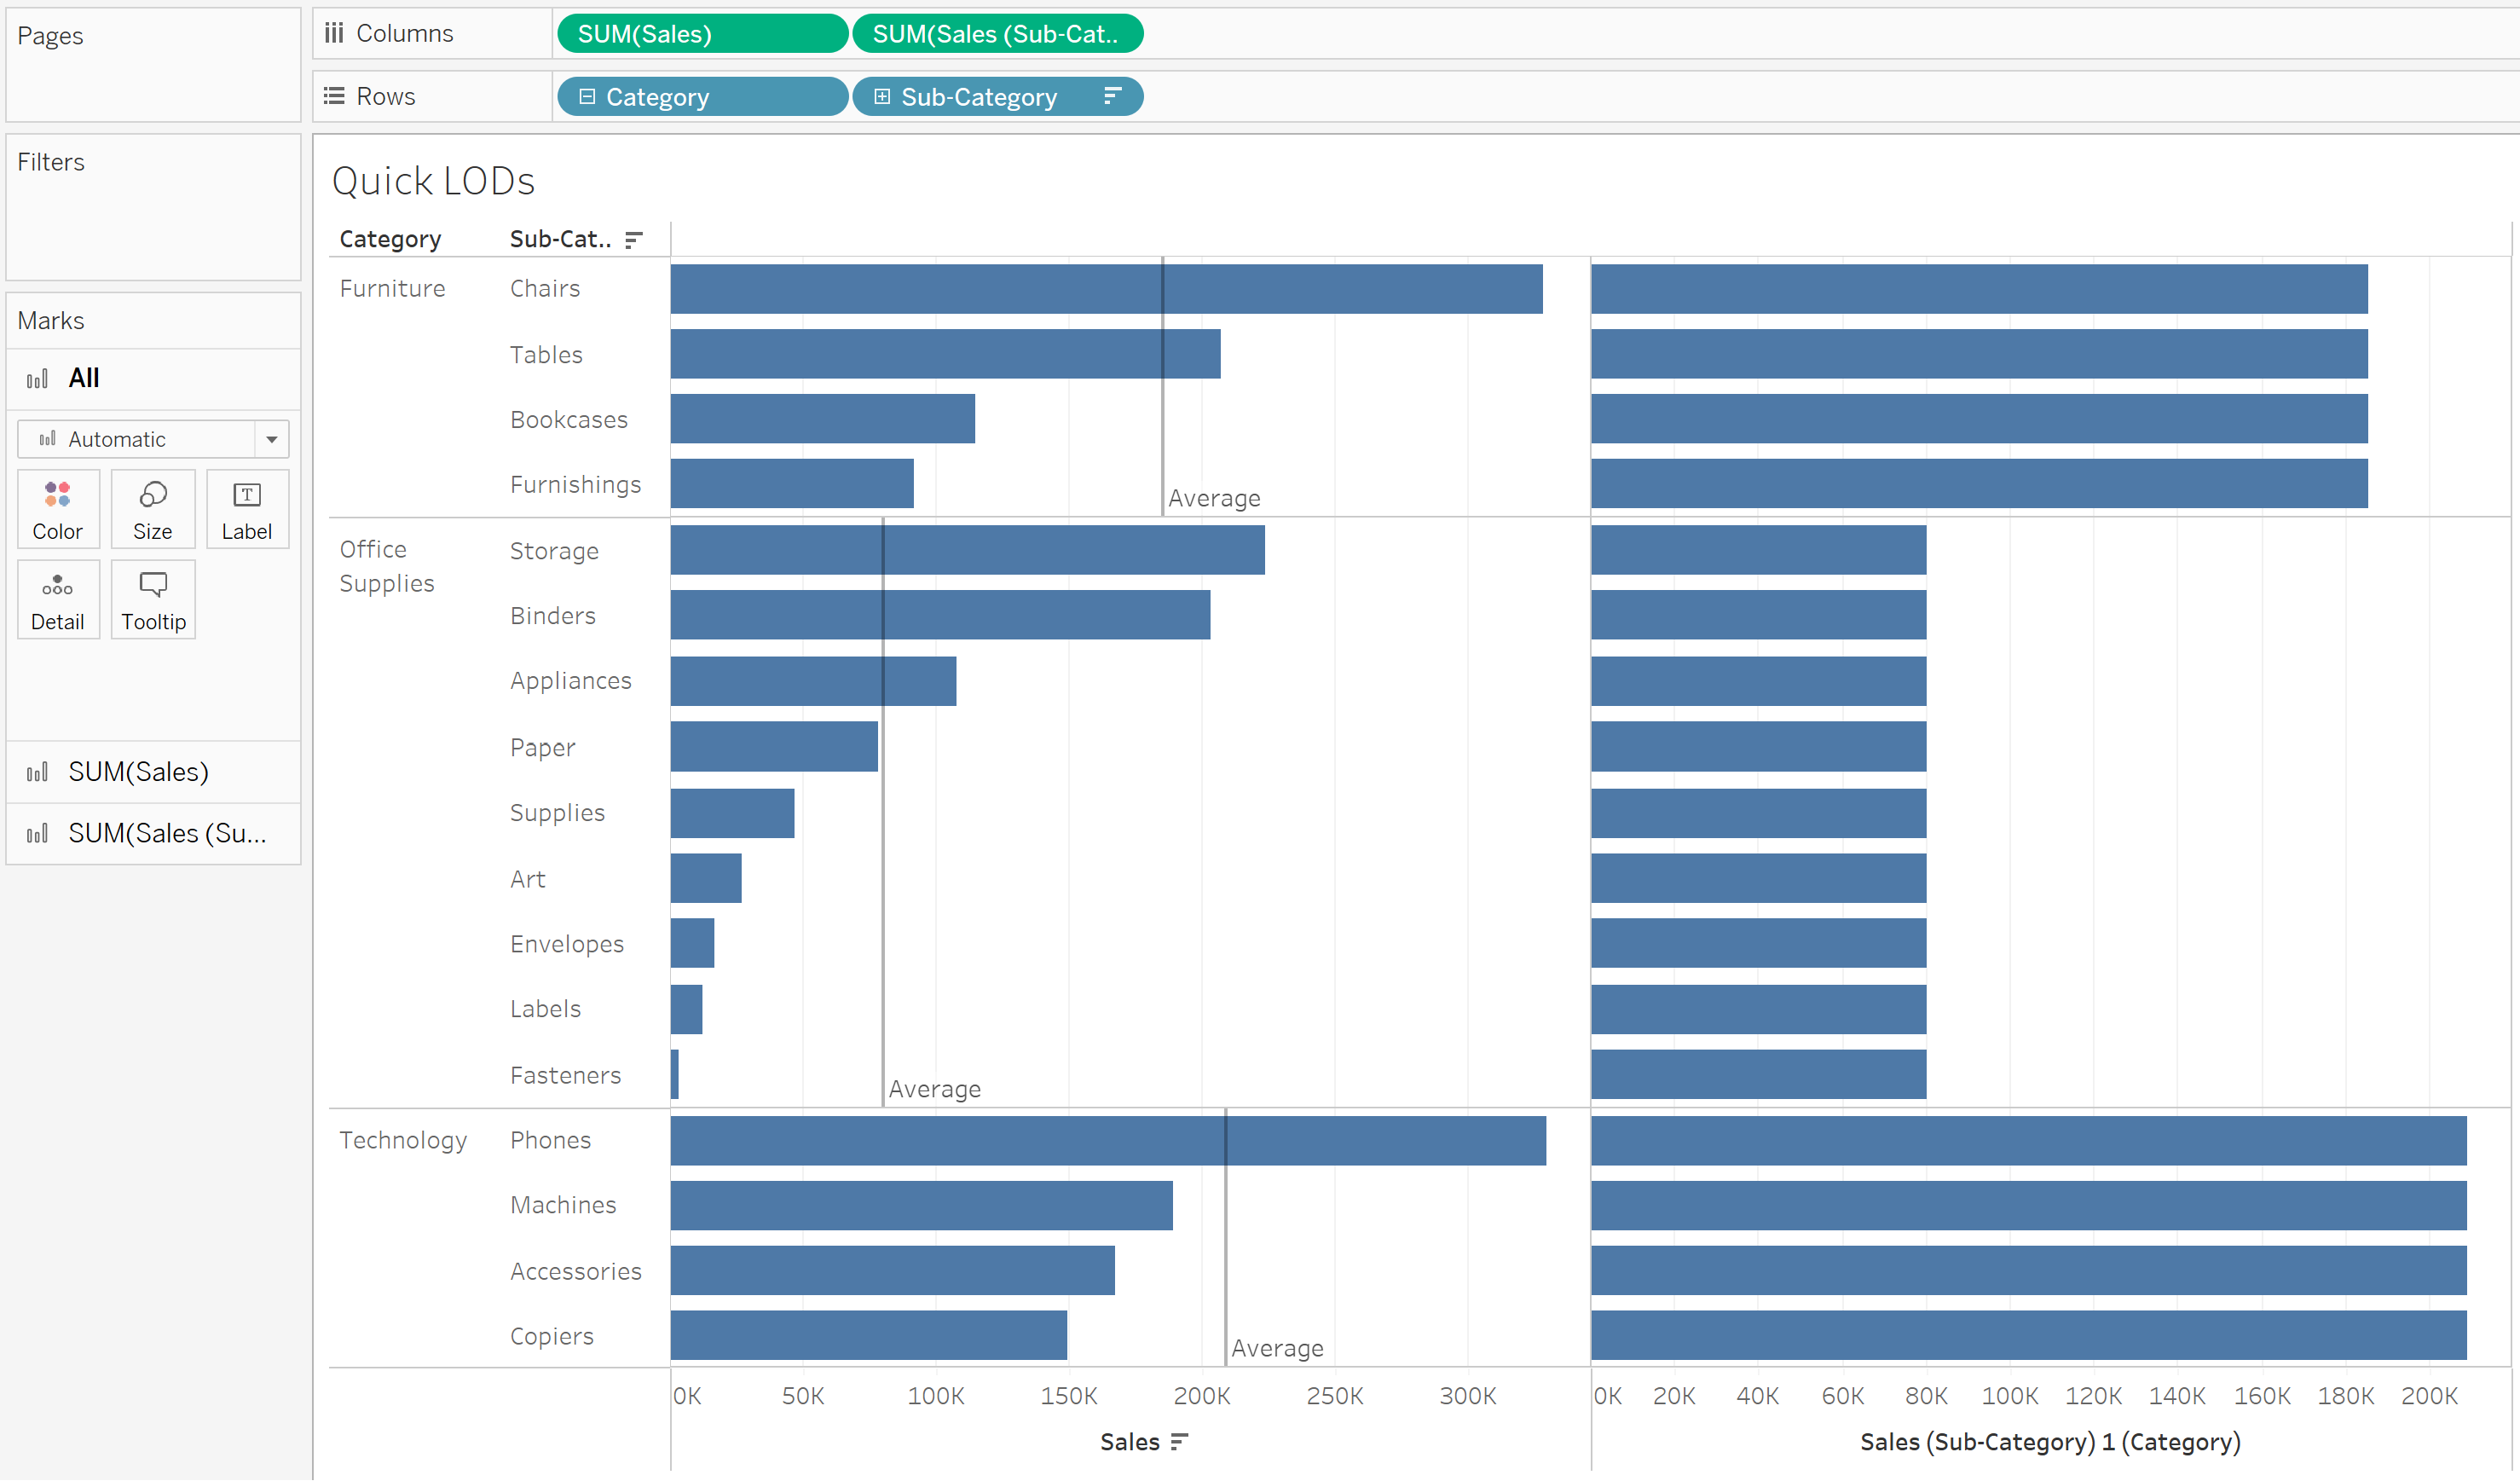
In Tableaus, if we calculate the average sum of sales at the Category level, We can use nested LOD to deal with that: (to make it easier to understand, I am going to break down the LODs by two steps)
First we need to create 2 calculated field:
1st LOD: { FIXED [Sub-Category]: SUM([Sales]) }
2nd LOD: { FIXED [Category]: AVG([1st LOD]) }
*If we want to write it in one go, it will be like: { FIXED [Category]:AVG({fixed [Sub-Category]:SUM([Sales]) })}
To calculate the average sum of sales at the Category level in Power BI, we can use ALLEXCEPT in DAX to do the same thing as FIXED LOD in Tableau. ALLEXCEPT removes all the context filters in the table except those that have been applied to the specified columns.
The measure will be like:
1st DAX: measure: CALCULATE(sum(Orders[Sales]), ALLEXCEPT(Orders, Orders[Sub-Category]
#for each sub category, give me the total number of sales
2nd DAX: CALCULATE( AVERAGEX(Orders, 1st DAX))), ALLEXCEPT(Orders, Orders[Category]))
#for each category, give me the average number of sales at sub category level
*If we want to write it in one go, it will be like: Measure = CALCULATE( AVERAGEX(Orders, CALCULATE(sum(Orders[Sales]), ALLEXCEPT(Orders, Orders[Sub-Category]))), ALLEXCEPT(Orders, Orders[Category]))
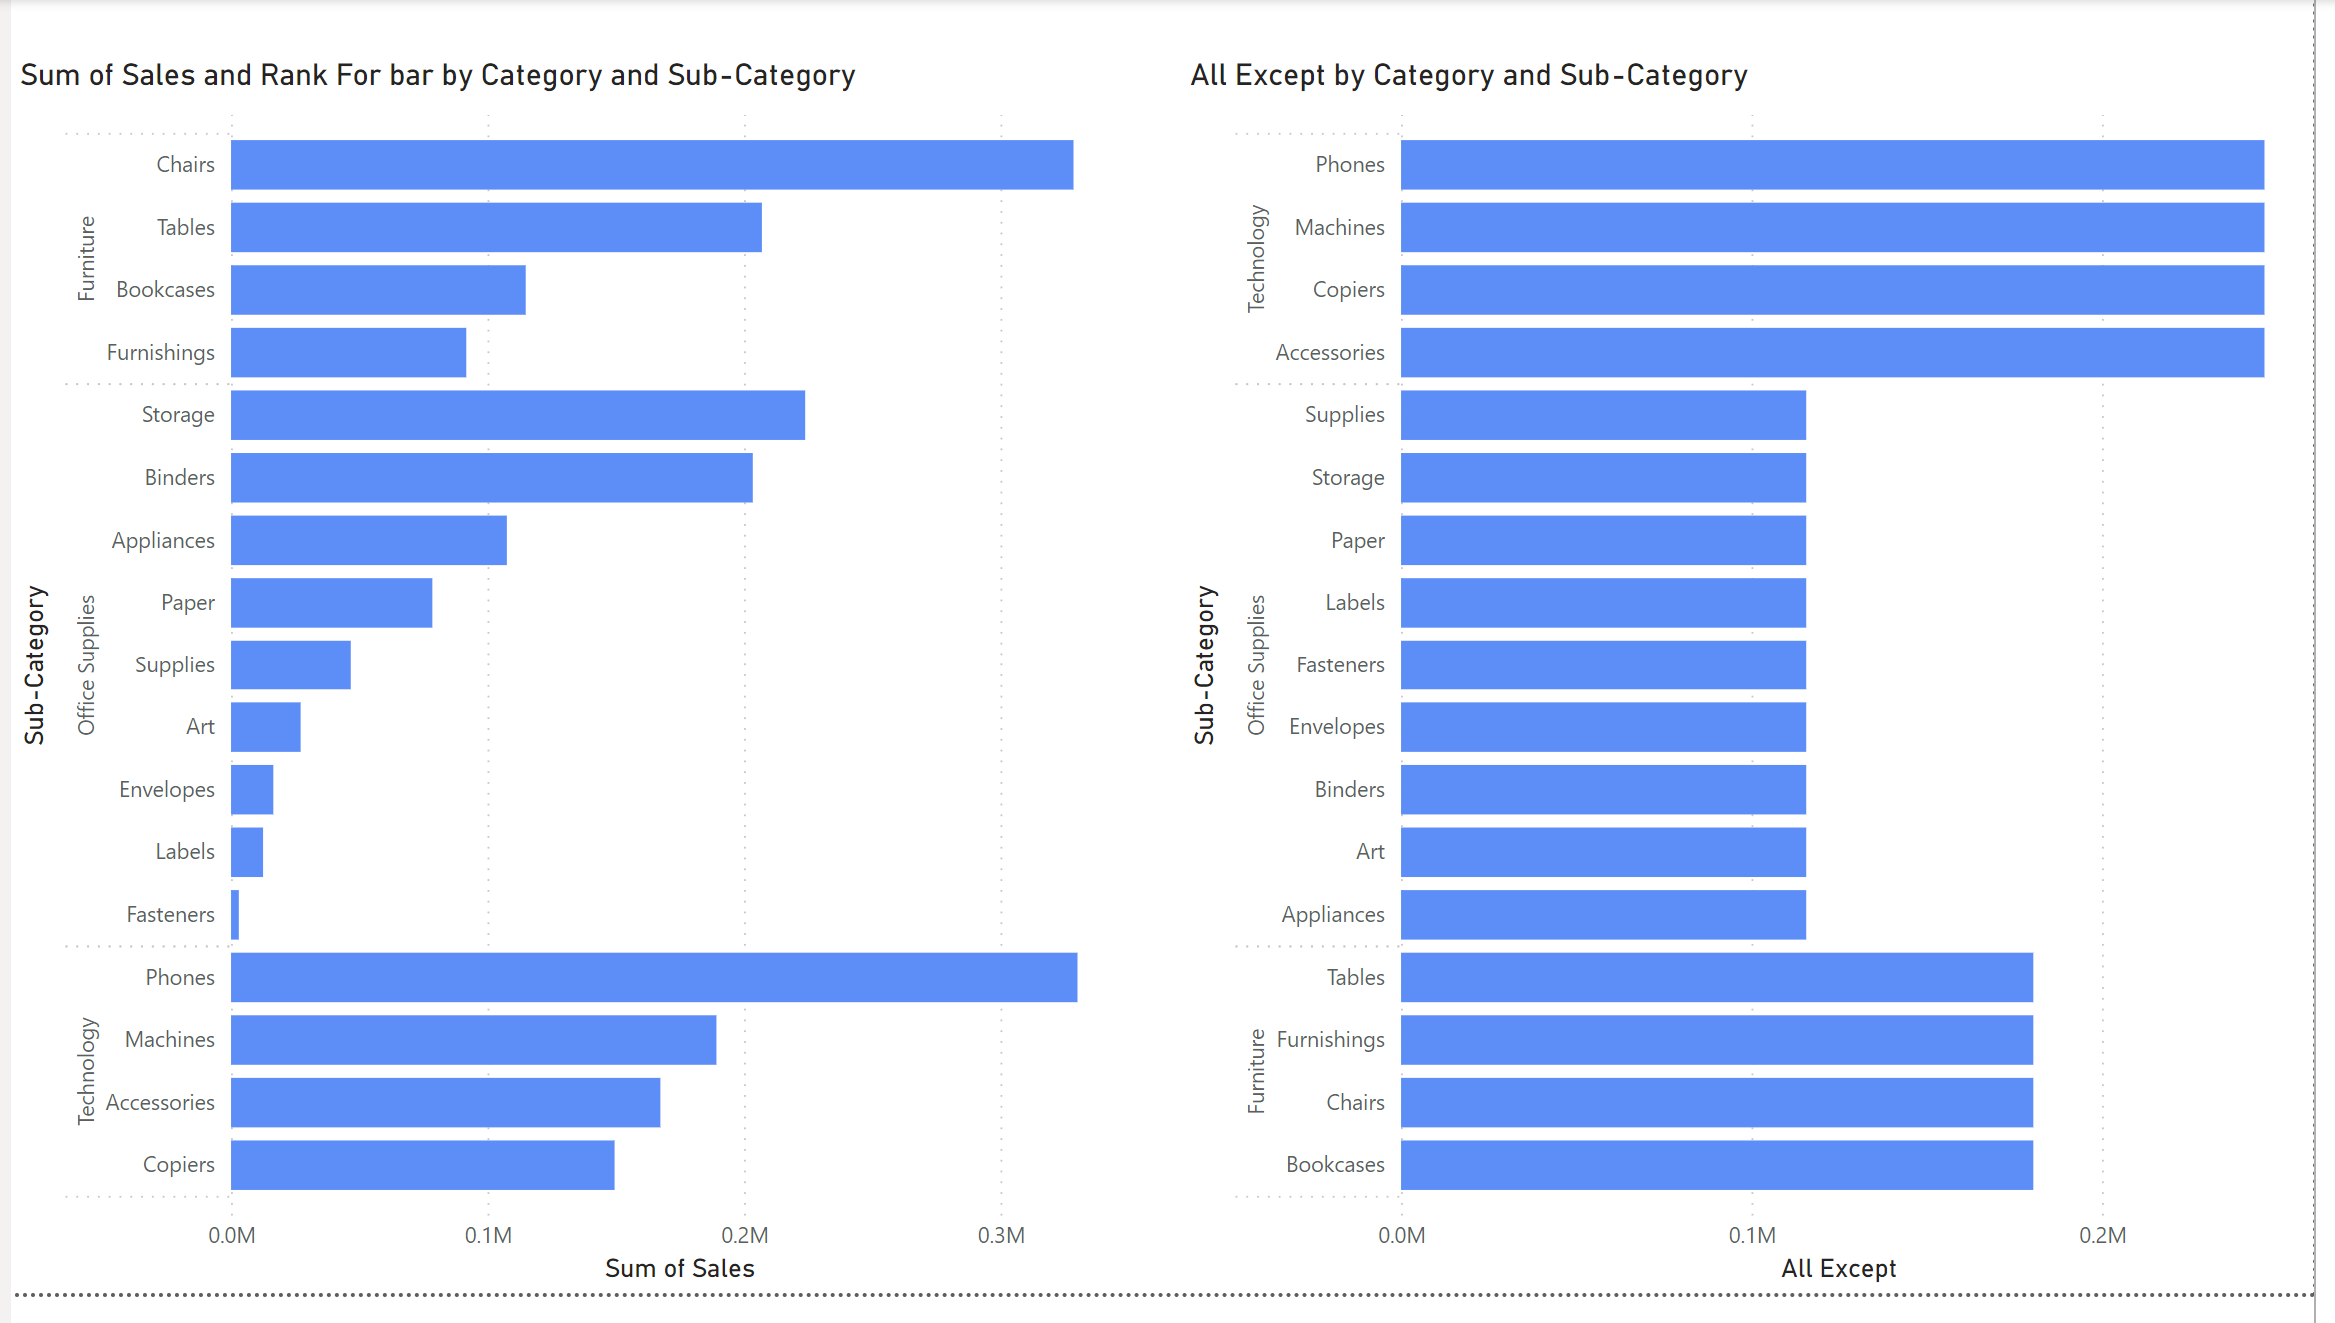
The you will be able to get the same chart as in Tableau.