


The Data School has a tradition of doing a Dashboard Week during the final week of training, often with a chance to redo one of our application vizzes. Due to scheduling pressures, the sixth cohort in the New York office had to switch focus, and that's why I'm writing this blog - we had a client project to examine publicly available data to explore different facets of firearms deaths in the United States. For my dashboard on the connection between firearms deaths and voter turnout, I needed to examine voting behaviors in election years to compare with firearms deaths, and while I ended up using an already collated data set on voter turnout, in the future I'd like to examine the relationship of race and/or gender on these factors. To do that, I need Census data; here's how I can retrieve it.
Query fundamentals

The first step is to examine the Census API user guide. It can be a bit obtuse at first, hence the need for this guide, but it can be helpful. You'll want to figure out which data set you need. For my purposes, the 2000 (green) Community Population Survey (red) was what I needed. To find datasets, use the API Data Discovery Tool; this is machine readable, so for brave souls in need of a web scraping practice project, there's a suggestion for you. Each dataset has information about geographic levels of aggregation available, and variables you can query; these variables (yellow) go after the question mark in your query. You can also tabulate information but I've found that route to be more problematic. For my project, the variable information rested here. After listing out your variables, separated by commas, you can then change which geographies you're querying by writing "&for=", then the level of geographic aggregation, followed by a comma, and either a * for all or a specific code (blue). Finally, you can query certain variables about citizen types (pink); confusingly, explanations of these fields rest in the same variable dictionary as the variables. Finally, after "&key=", you'll write your own API access key, which you can get by signing up for a key using the prominent ad box on the left hand side of the screen here or on other pages of the Census Developers page.
Example queries for each dataset are linked to in the API Discovery Tool; the examples for my dataset are reproduced above.
Using the query
You've figured out how to do a query, and maybe even pasted it into your browser to see what you get from it. How, then, should one use it in Alteryx? That's exactly what I wanted to know. The first thing to know is that the file format is nonstandard JSON. Thankfully, Alteryx's JSON parser helps.
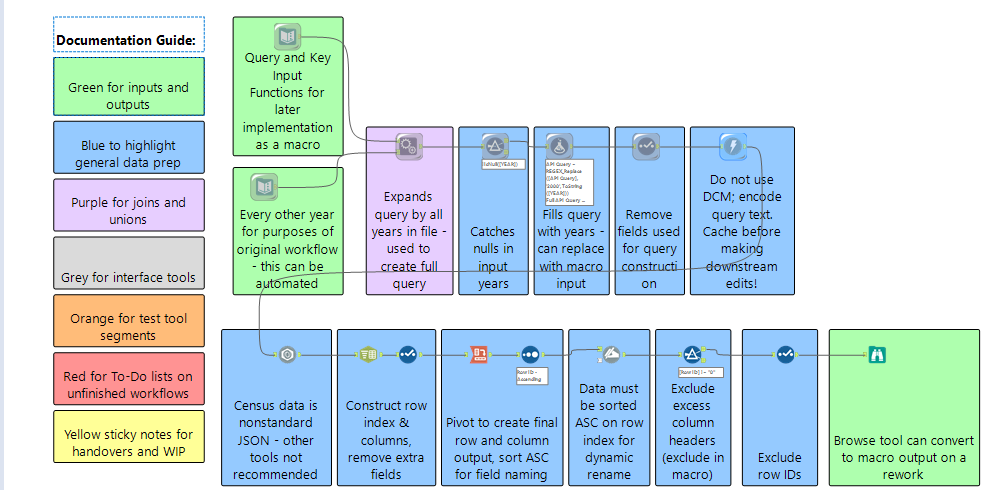
My workflow started with a query builder, with my query and key stored separately, as well as a table of years. I needed the years because I was looking at change over time, and I needed to not get data for non-election years. I appended each year to the query/key combo, expanding my dataset, and then did error checking by removing null years. I used the formula tool to plug the year into the appropriate slot in the query, and then passed my query to the Download tool. Unless you know what you're doing, don't use the Data Connection Manager.
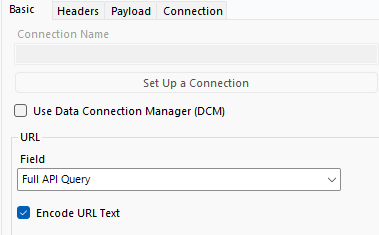
I used the Encode URL Text option to get past persistent download errors with this workflow and that of another guide used when researching this article.
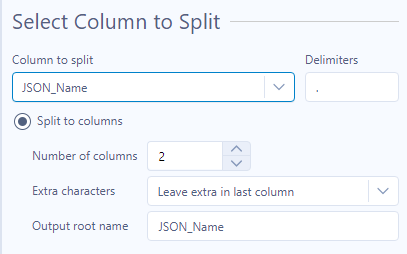
From there, it was a matter of making sure to cache the output so as to avoid hitting taxpayers with the bill for repeated queries, passing the downloaded data for each year to the JSON parser, and then splitting the JSON_Name field into a row ID and column ID. Row 0 has your field names, which you'll use when pivoting the data later - the current dataset is so tall as to be unusable.
The last major point where you might get tripped up is in the pivoting. I'll happily admit this caused trouble for me because at least on the AMP engine, the output of the pivot isn't sorted. Make sure to sort by Row ID ascending after the pivot to bring the column headers to the top so the Dynamic Rename tool can pull values from the first row to create a properly named table. After that it's just whatever cleanup you need to do and outputting your data.
Wrapping up and Acknowledgements
This workflow should be simple to recreate, and will adjust automatically to adding more or fewer fields to research; in the future I hope to update it with the creation of a macro that should be more efficient and can be incorporated into your own workflows. Watch our blogs and our social media for updates. Feel free to reach out to me on LinkedIn if you have any questions, or if your organization might be interested in the services of our Alteryx and Tableau experts.