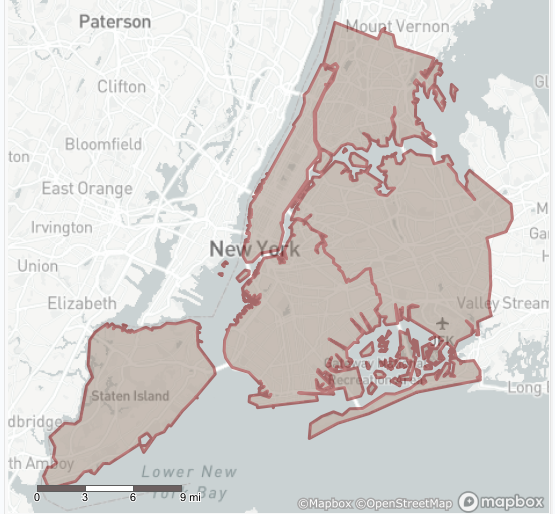
In the last entry in this series, you learned how to input spatial data of various types and create a basic trade area around individual points. Now we'll build on those skills by helping you smooth out and reduce the complexity of spatial files, build a grid for analysis, and build buffers around shapes. Combined with the tools in the previous entry, you should be ready to move on to analyzing intersections, overlaps, and the characteristics of your spatial data.
Generalize

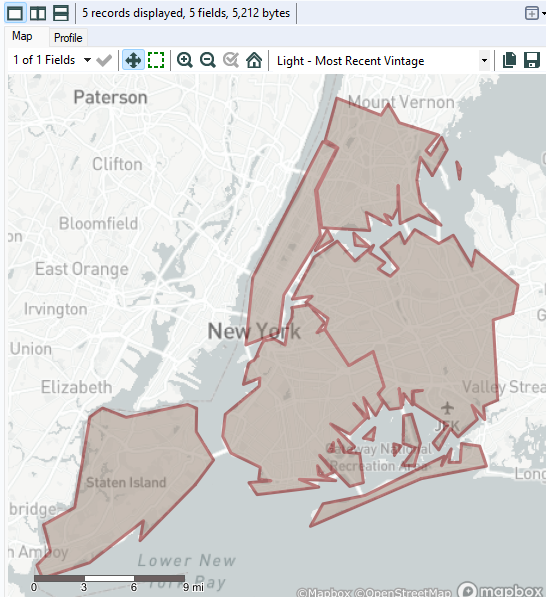
The Generalize tool smooths out borders, removing some projections and filling in involutions according to formulas more complicated than you need at the 101 level. Note the similarity of the tool's icon to the Buffer tool; there are some vague similarities but they do different things. Generalize can help improve performance, at the cost of accuracy, by reducing the number of vertices that make up polygons. If you are calculating the perimeter of a shape, you are likely to reduce the value of that calculation due to the coastline paradox, possibly drastically; edges and boundaries, especially in the natural world, tend to have fractal complexity. The most important thing to remember is to select miles or kilometers from the dropdown and adjust the threshold for smoothing as you like.
Make Grid

The Make Grid function is very useful, but its use case isn't necessarily obvious. The primary use case is to break up defined spatial areas into discrete chunks, to allow for aggregation somewhere between a point and the entire area.
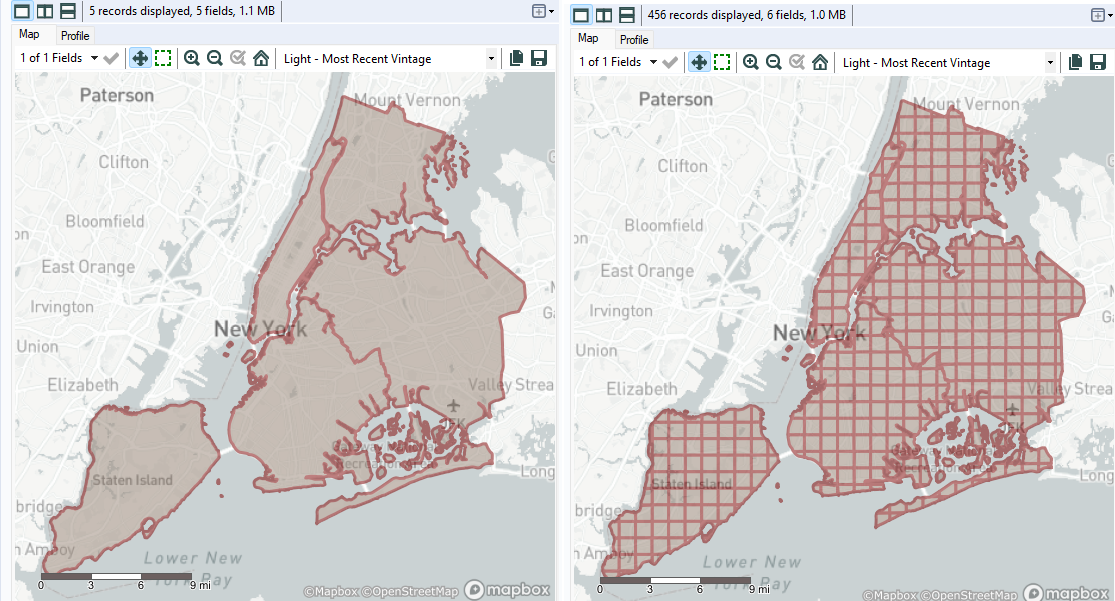
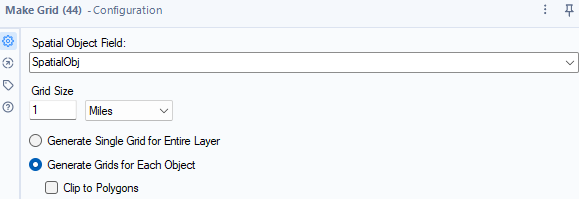
There are some important configuration caveats. If you want the grids you create to end at the borders of your polygons, as is shown in the above image, make sure to select "Clip to polygons" under "Generate Grids for Each Object" in the configuration menu of the tool. Otherwise the grid will extend outside the borders of your polygons, potentially leading to double-counting of data points at later stages of analysis. You can also create a grid for the entire map layer, disregarding the boundaries of the polygons entirely. Finally, make sure to decide the size of the grid you want to construct, and define whether it's in miles or kilometers.
Buffer

You should be able to create a buffer around the shapes you've created or are working with in order to account for inaccuracies or for whatever reason you need to extend shapes. In the process some generalization will occur inherent to the process, but you can also enhance the generalization through a selectable option.
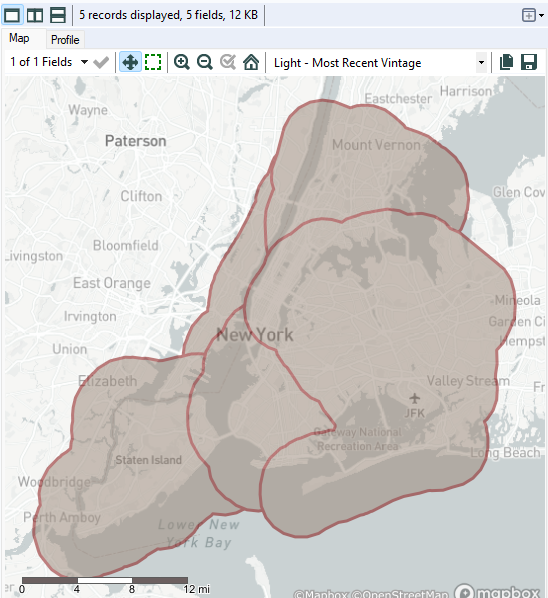
Buffers can run into and over each other, and you will need to use additional tools to resolve those conflicts. Much like the Trade Area tool, the Buffer tool has additional configuration options available when you bring in additional fields to help change the function of the tool.
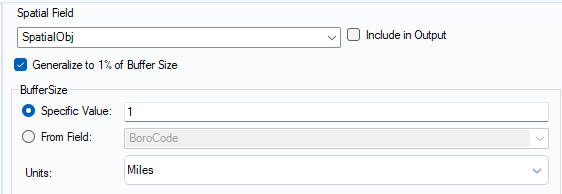
Buffering creates some generalization because of how the boundary is generated, but you can select the "Generalize to 1% of Buffer Size" option to add additional smoothing and suppression of detail. The least complex, but most accidentally overlooked, function is to switch between miles and kilometers. For many purposes, you'll configure the buffer size to a specific value - but you also have the option to dynamically adjust the buffer size based on an additional field. For instance, when calculating various countries' Exclusive Economic Zones and naval territorial claims, one could enhance country map data with buffers calculated with information about countries' naval territorial claims. As long as the additional field can be represented as an integer or float, it can be used.
Conclusion
Alteryx is not always used for spatial data due to its relatively modest visualization capabilities, but with the tools identified in part 1 and in this part, you should be ready to experiment with spatial data and identify use cases for your organization. In following parts, you'll learn how to combine what you've learned with new tools to permit detailed analysis and deliver value with spatial data.
