


Intro
As most of us might have heart already there are better and worse forms to visually transform data. Though there are many ways to create good or less good data visualisations we can abstract from that to set of data visualization practices which will be the general topic of today’s blog article.
Still, it would be too much to even give a glimpse of all best practices in one article. So this one is about a small snippet of them namely BAR CHARTS from Stephen Few’s point of view taken from his Book “Show me the numbers” (2004).
Note
Even a simple visualization such as a bar chart could comprise of unanticipated technical depth and detail. However, the practical application does not need such level of detail and depth since we are not designing a new chart type but applying an existing one.
The real value of Stephen Fews consideration lies in as to WHY certain visualization techniques can be considered best practices and others not.
Definition
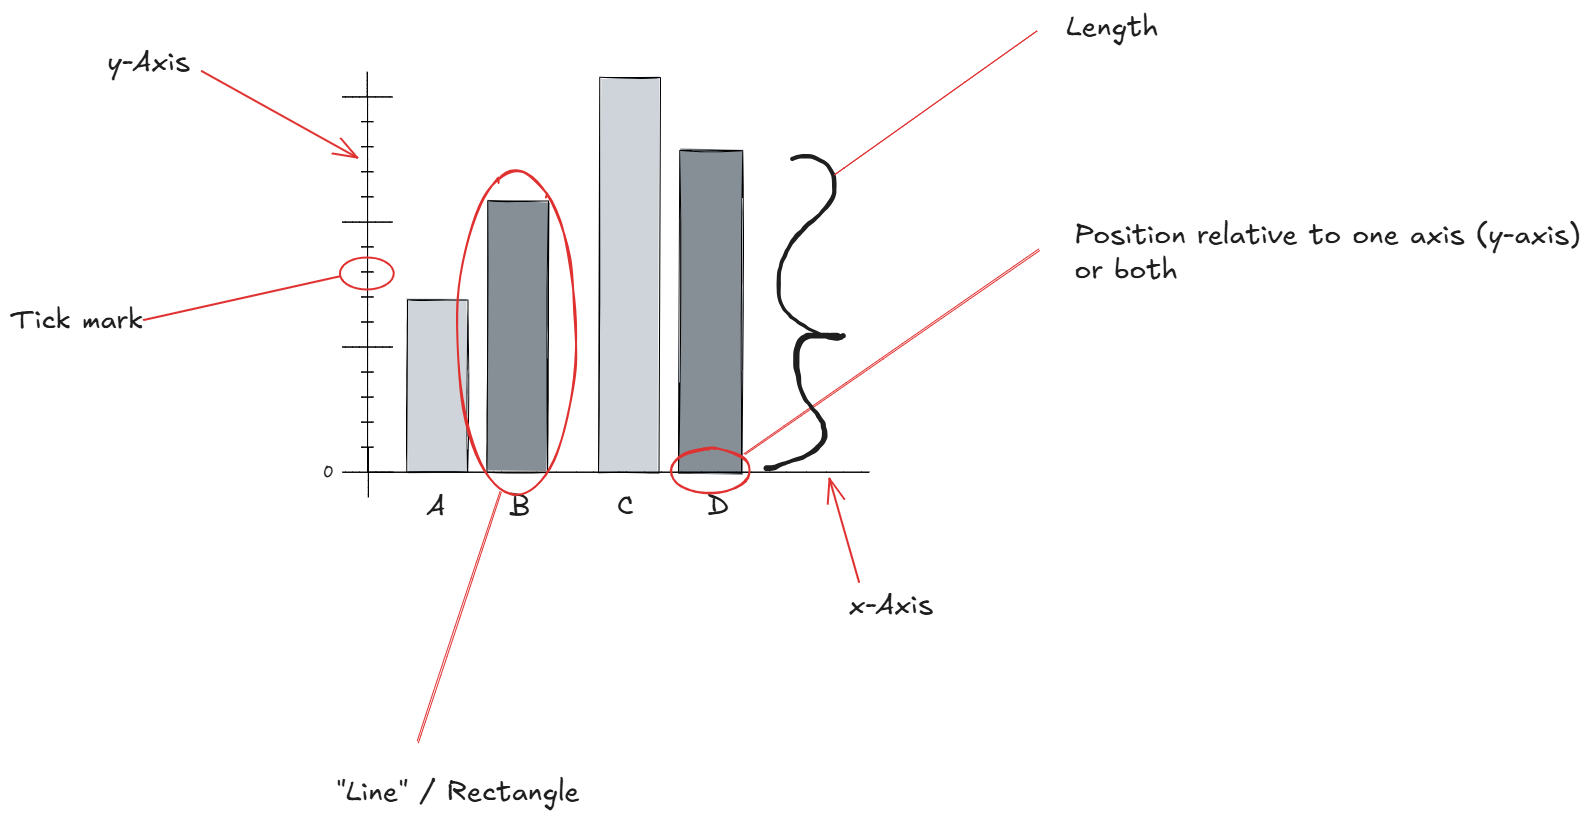
A BAR CHART is a visualization which comprises of the following elements and encodes data values exclusively with its length from the position relative to one axis as the starting point:
- “Line”
- Length
- Position relative to one or both axes
- Tick marks (value markers on the axes)
Best practices for using a BAR CHART
When? Why?
A BAR CHART is best used for when working with individual discrete values according to Stephen Few. This is because of their visual weight BAR CHARTS let invidual values stand out “clearly and distinctly from another”.
How?
BAR CHARTS should have bars with equal thickness to not withdraw the readers focus. This point is important because the thickness of the bars doesn’t encode data. Therefore unequally thick bars could make a misleading or even manipulating chart.
Furthermore, the area within the bars should not be filled with patterns whenever possible. Fill patterns make a very noisy display and we might actually feel ill by looking at them.
The base of BAR CHARTS should always begin at the value zero as goes for other plots. Another base distorts our perception of how large the differences are. A non-zero base exaggerates them.
It is worth mentioning at this point that many of these best practices should be automatically taken care of by Tableau
Special use case: Horizontal bar charts
Last there is the special case of horizontal bar charts to be considered. First, they are a greate choice for ranking graphs and other scenarios where vertical bar charts are not apt.
On the other hand they cannot be used for visualisations which requires the x-axis for a scale. This is the cases for time series, for example. Here the x-axis has to be used for the time scale.