Hello, everyone!
As promised, here is the second installment of my week long series, brought to you by Dashboard Week. After yet another day of smashing away at the keys on the keyboard and rolling my eyes at myself for opening up Tableau 10.1 instead of 10.3 at least 12 times – some of you out there will understand – I’m excited to share the tips and tricks I’ve learned.
The topic for today was none another than everyone’s favorite beverages: Beer and Wine. Andy allowed us to pick whichever one of these elixirs of life we preferred (as the token Frenchman of the team, I had to pick wine) and left us with the responsibility of building something to brighten the world’s day. After initially setting myself up to use an API to download some data, but realizing I could simply download a beautiful data set directly from Kaggle, I decided instead to focus my attention on something very different: sentiment analysis. You may remember one of my earlier blog posts where I explained how the sentiment analysis macro in Alteryx works. Well, today, I’m going to show you how you can get the same results by using nothing else but some simple R code and Tableau. And yes, I do mean VERY SIMPLE R CODE.
I’m first going to show you guys what viz I built today, and then give you a quick run through of how you can obtain some sentiment scores from any text data you may have.
Game Of Wine: The Wars Are Coming
The data I used for today’s visualization is composed of over one hundred and fifty thousand wine reviews compiled by WineEnthusiast. You can find it right here if you want to build a viz out of it yourself. Let’s start by taking a look at the data:
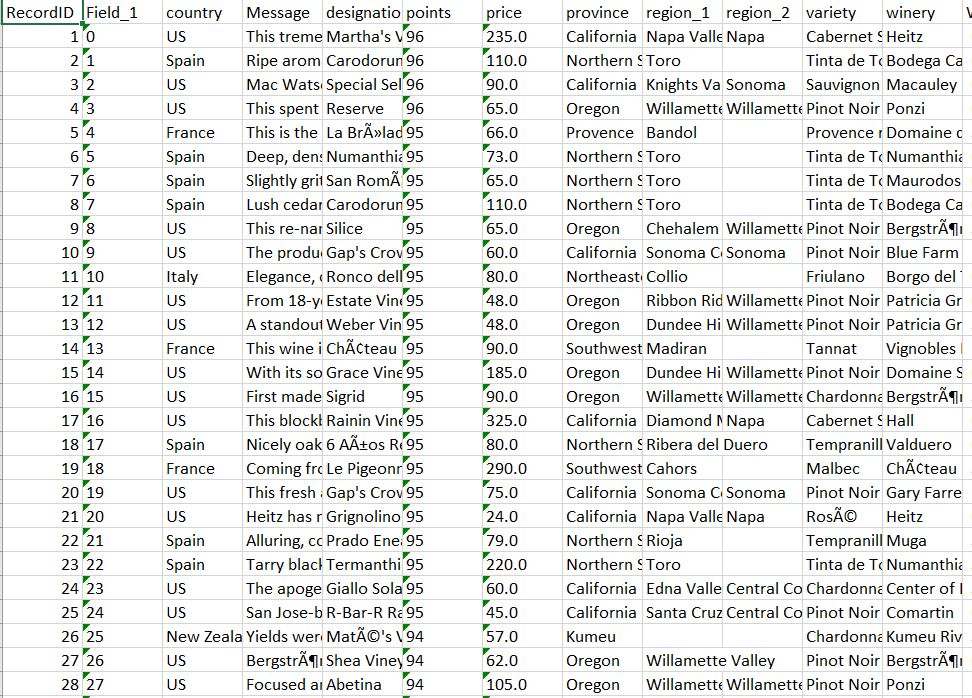
As you can see, I was blessed with a beautiful set of clean columns and rows, with a few strange symbols here in there in the string fields, but nothing to be worried about. This meant less time cleaning, and more time visualizing! My plan was to build something similar to yesterday – a statistic comparator – but this time to allow someone to allow to compare the average price, points, and review sentiment of the wine bottles between countries. Once again, the aim is to build something simple, interactive, and mainly fun!
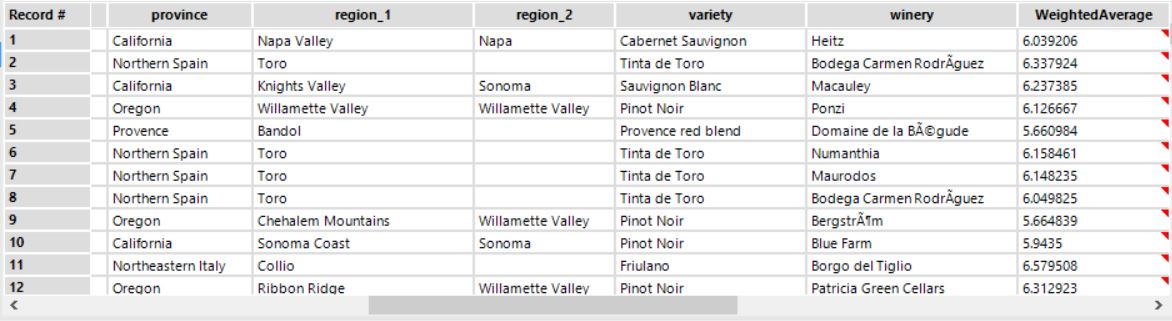
In order to obtain sentiment scores from the reviews, all I had to do was use the Alteryx Sentiment Macro. This tool will look at all the words within a text field, assign them a score based on a built-in “sentiment dictionary” that has been precompiled by linguists and language experts, and assign that review a single score, called a Weighted Average. Here’s what that workflow looks like, with the final output I obtained.

Now that my data was ready, it’s all about putting it together in a neat little package! I decided to go with something very simple, smooth, and that required a lot of user interaction so as to make it as much of a game as I could. The bars inside the wallets and the wine bottles evolve dynamically as the user selects a country, as do the smileys. I’ve also started adding an info button in the majority of my vizzes: it’s a great place to add instructions and put and miscellaneous information (sources, author, etc.) without having to sacrifice any space.
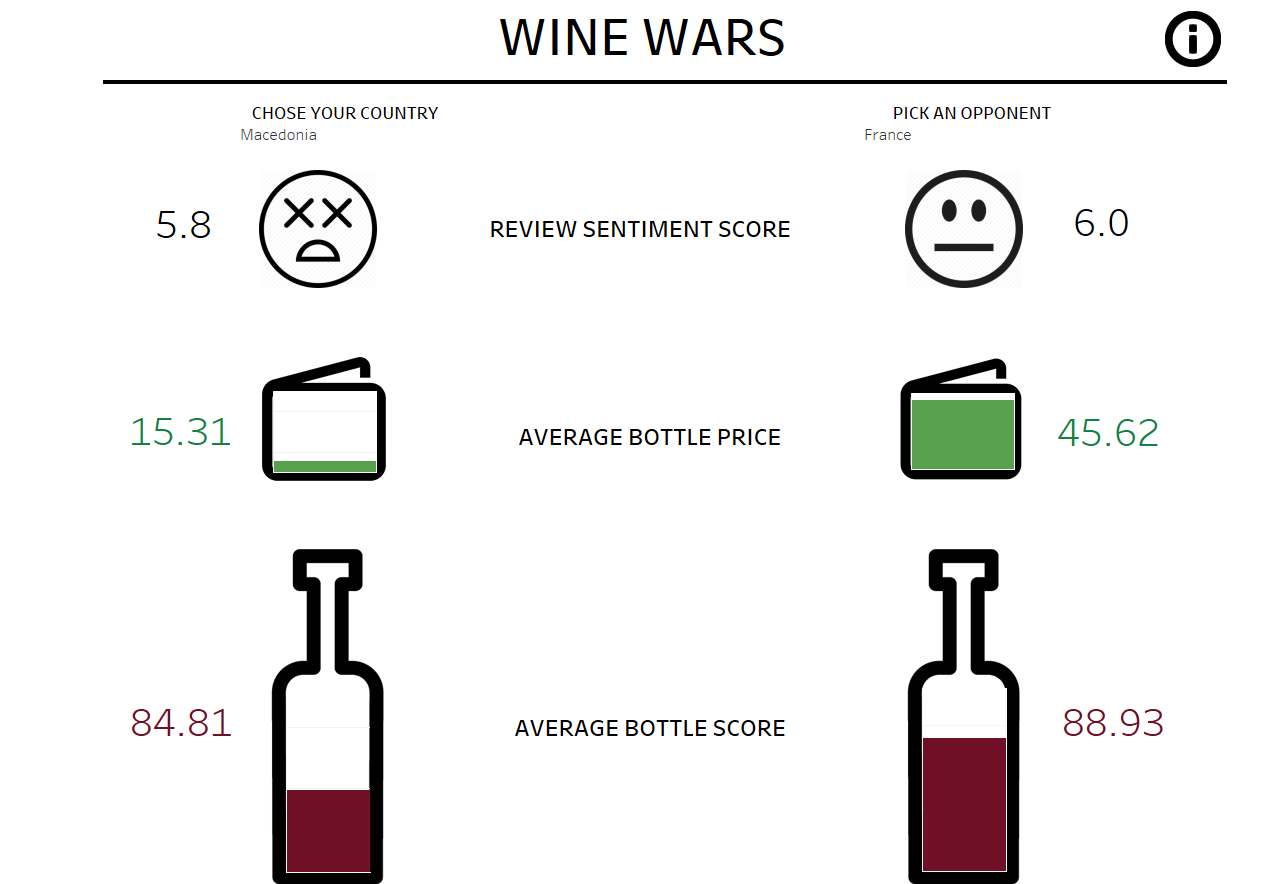
You can check it out and play around with it here on my Tableau Public profile!
Now, you might think this doesn’t look like much for a full day’s work. And you would be very right. The reason for this? I’ve been working on something special for you guys today. Tune into part 2 of this blog post to check it out!
