A dashboard-and-a-blog-post-per-day-week – day 2 – challenge details here
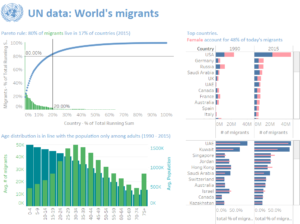
The dataset for today is United Nations migration data. The main task was to clean the data and join 5 tables. As the tables have the similar structure I though I can use a dynamic input tool, which we have learned about during last Alteryx User Group. Eventually in turned out that Table 13 was slightly different, but it was still helpful to use Dynamic Input for Tables 14-18.
The tables were looking at a % of migrants per country, gender and age group. I didn’t think we could do a lot with this data as we could not aggregate the percentages. My immediate thought was to go for bump charts (rankings), but I have already practiced them with #MakeoverMonday data, so I wanted to try something different.
Due to data limitations, it was quite natural for the team to try to import some more data. I would not be surprised if it was another Andy’s cheeky experiment, just to see what we decide to do.
As mentioned the tables were similar, so preparing data from more sheets should be easy. Having thought that I have moved on to do that and wasted a lot of time. It was not easy to download the first set of sheets (with numbers of migrants), because of a random number of null columns in each table. Dynamic input would not pick them up as the structure was different (at least in practice). So instead I had downloaded the second set of tables – population data – and calculated the number of migrants with a Formula.
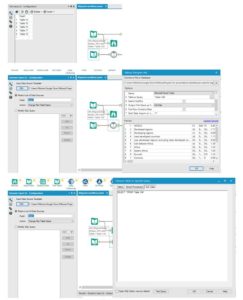
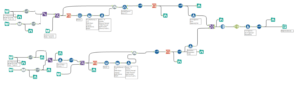
I think I have spent a lot of time on the workflow comparing to others. I know that my first placement will focus on Alteryx so I carefully study examples for each tool. In exchange, I completely neglected the tidiness and documentation of the workflow. This is how the workflow should not look like:
I also regret resigning from the initial ideas for the dashboard. In the evening I ended up very tired and with no clue on how to proceed. Eventually, I just exercised elements which I haven’t used in my dashboards before like Pareto chart and more descriptive approach to charts.
Despite sleep deprivation, I appreciate a lot of practice and oddly enjoy this week.
Wiktoria