A dashboard-and-a-blog-post-per-day-week started at The Data School, yay! Read more about the challenge here.
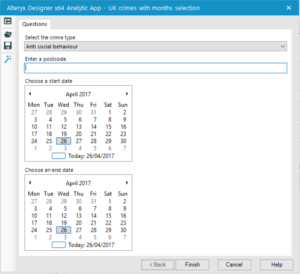
The first data set we got to work with was UK Police API with crime data. The task was to create an app which allows a user to select the crime category and a date range to download. Why those two parameters? Apparently, because they were NOT among the 15 well-documented parameters on the website 😀
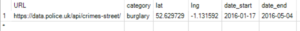
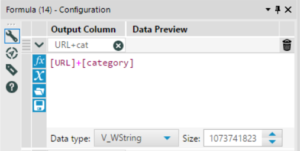
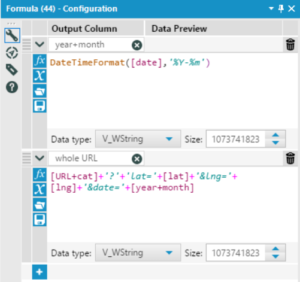
The challenge with the crime type was that its value was an integral part of the URL. It didn’t have the standard “category=” definition, so the URL had to be built with the formula instead.
https://data.police.uk/api/crimes-street/all-crime?poly=52.268,0.543:52.794,0.238:52.130,0.478&date=2013-01
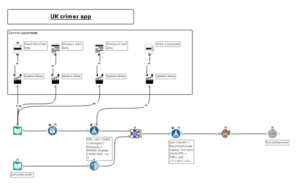
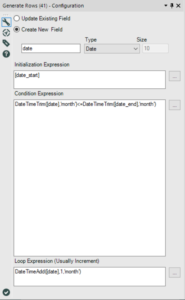
In terms of date range – there was only a parameter available to select a one, full month of data. To get a range, a batch macro was required which would run a download for multiple URLs – one URL for one month within a range selected by a user.
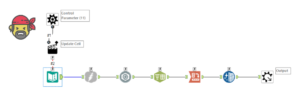
Generate Rows
Formula
All URLs go into a batch Macro
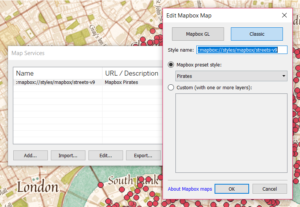
The last step in creating any dashboard is formatting. None of the three map color themes available in Tableau seemed suitable. I remembered Andy showing us mapbox.com. I went to the website and took the URL to one of the maps. Then I started playing with the settings. Pirates map, although not very clear, caught my attention as it corresponded well with the crime topic. I thought it will be fun to try something different.
Map -> Background map -> Map services

Wiktoria