Today is the first day of a dashboard week. Carl gave us data source from gov.uk.
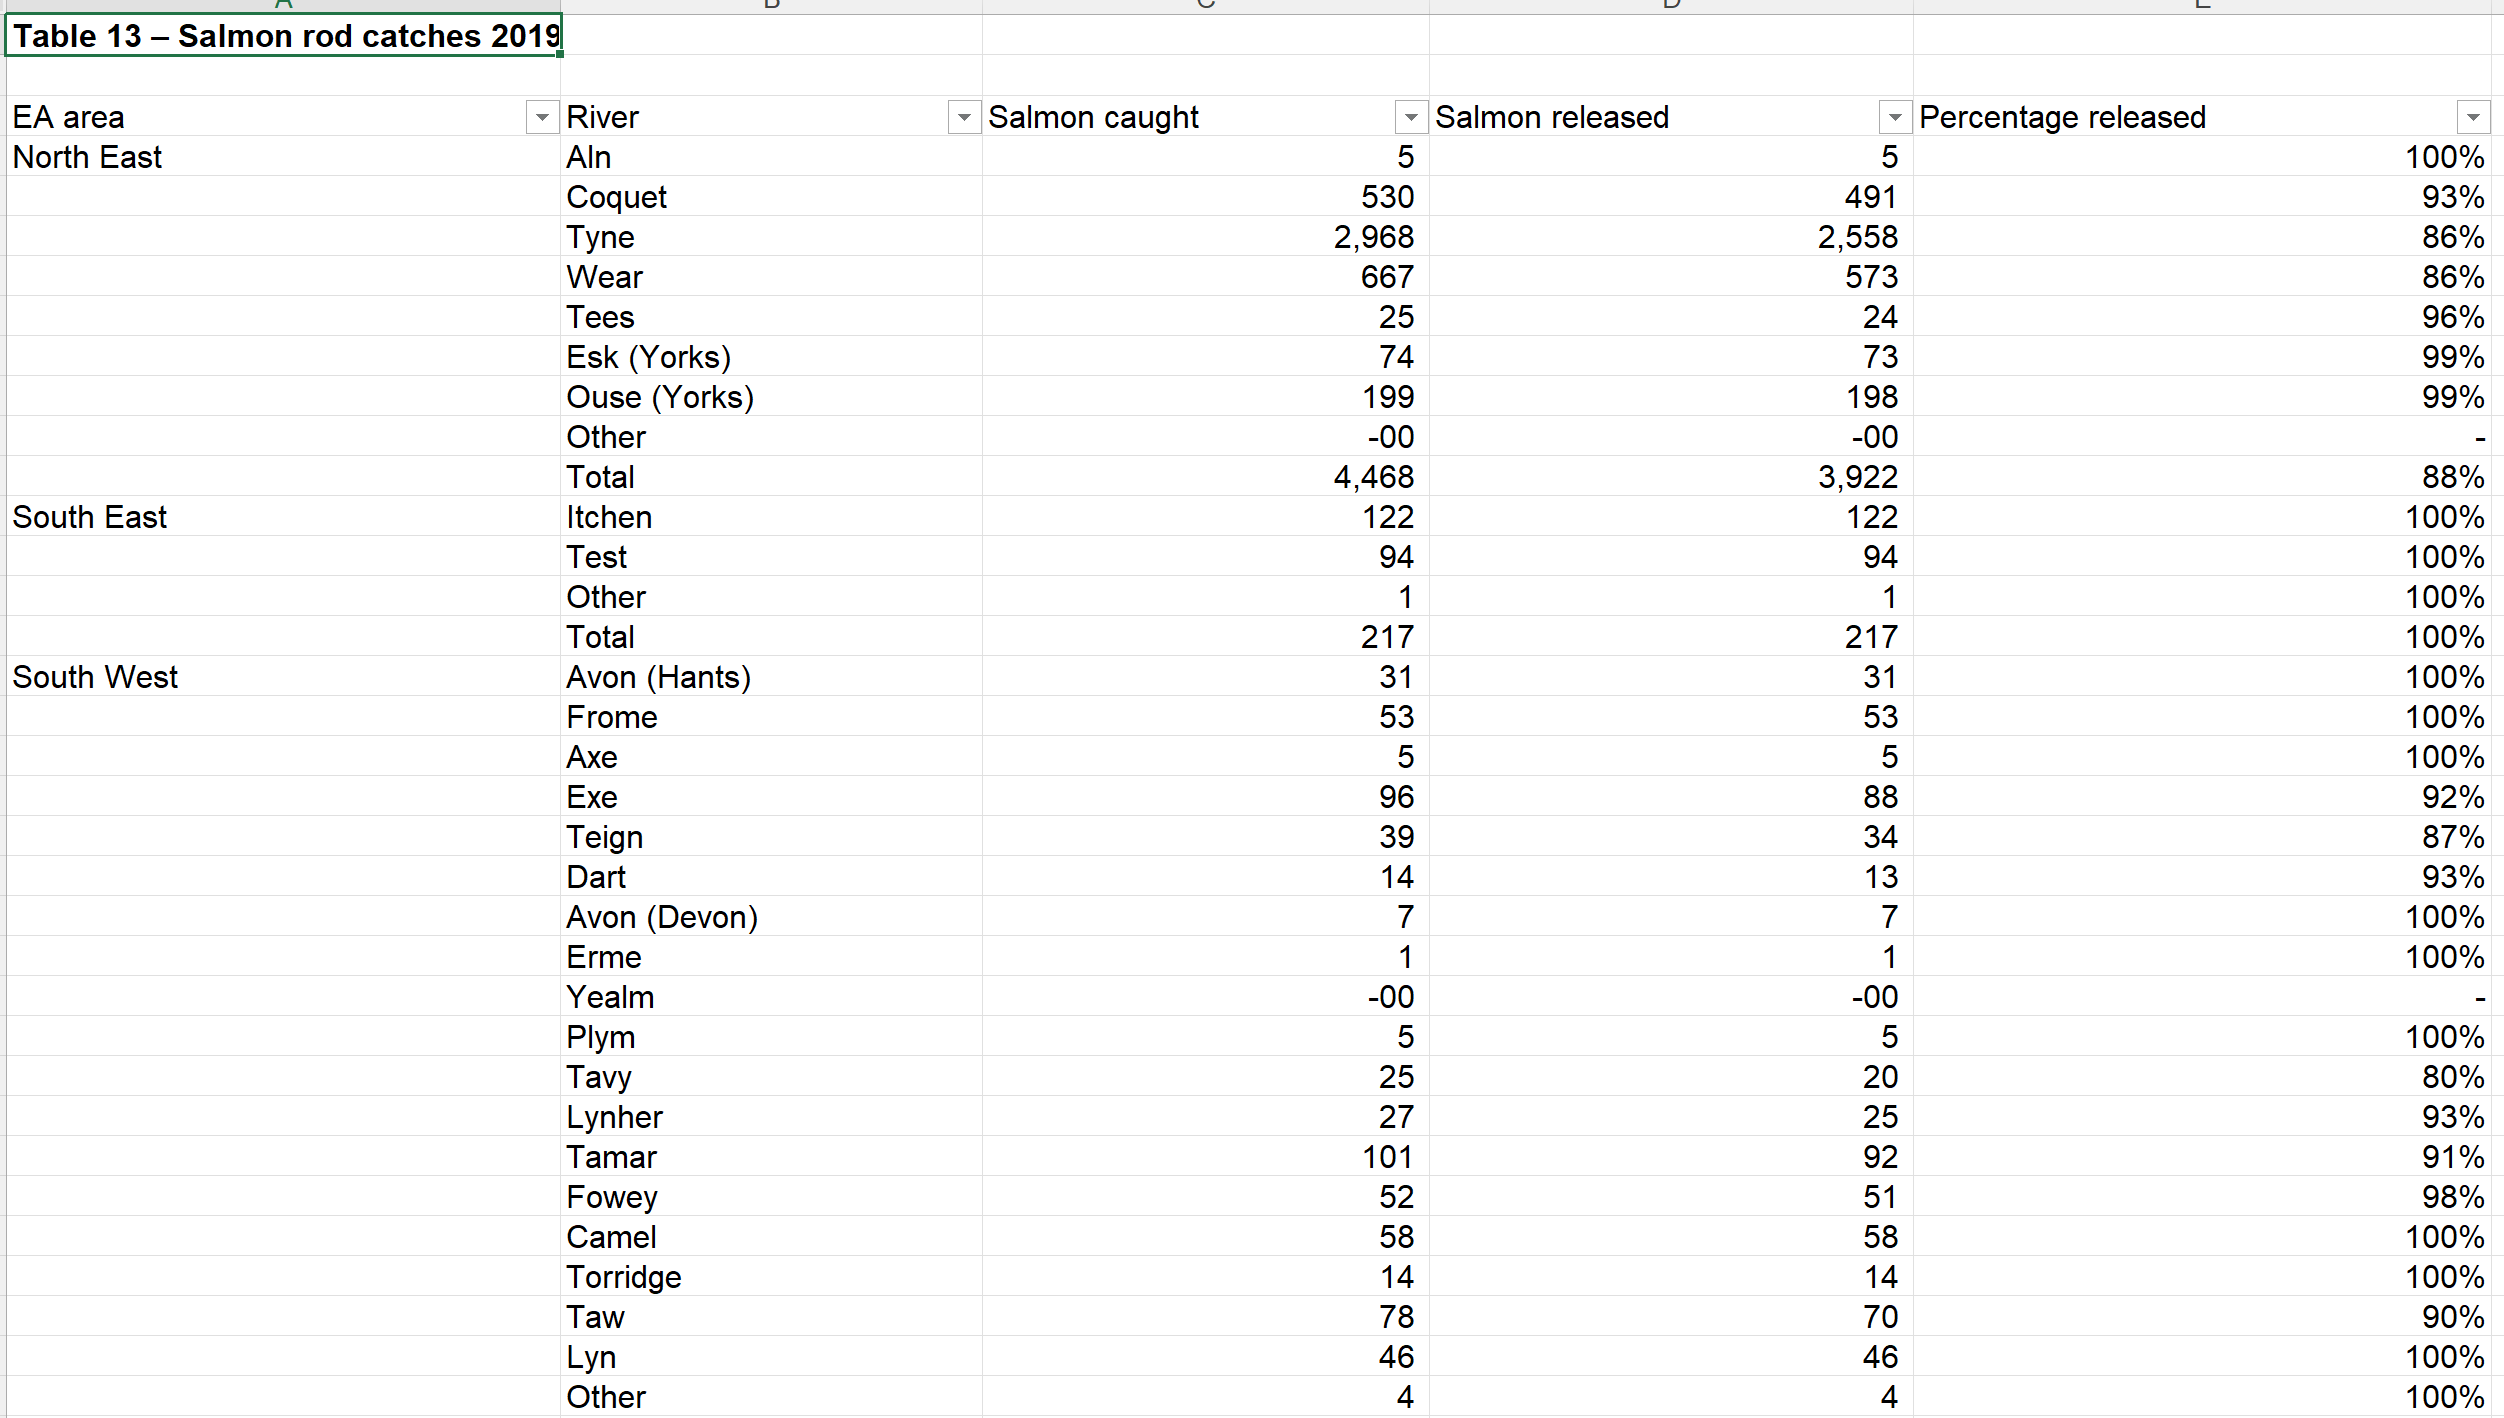
First thing first, what the data look like? The file was in OpenDocument format, so I needed to save it to Excel formal. File had 4 sheets for topic #5.
This data definitely needed to have some data preparation. I choose Alteryx.
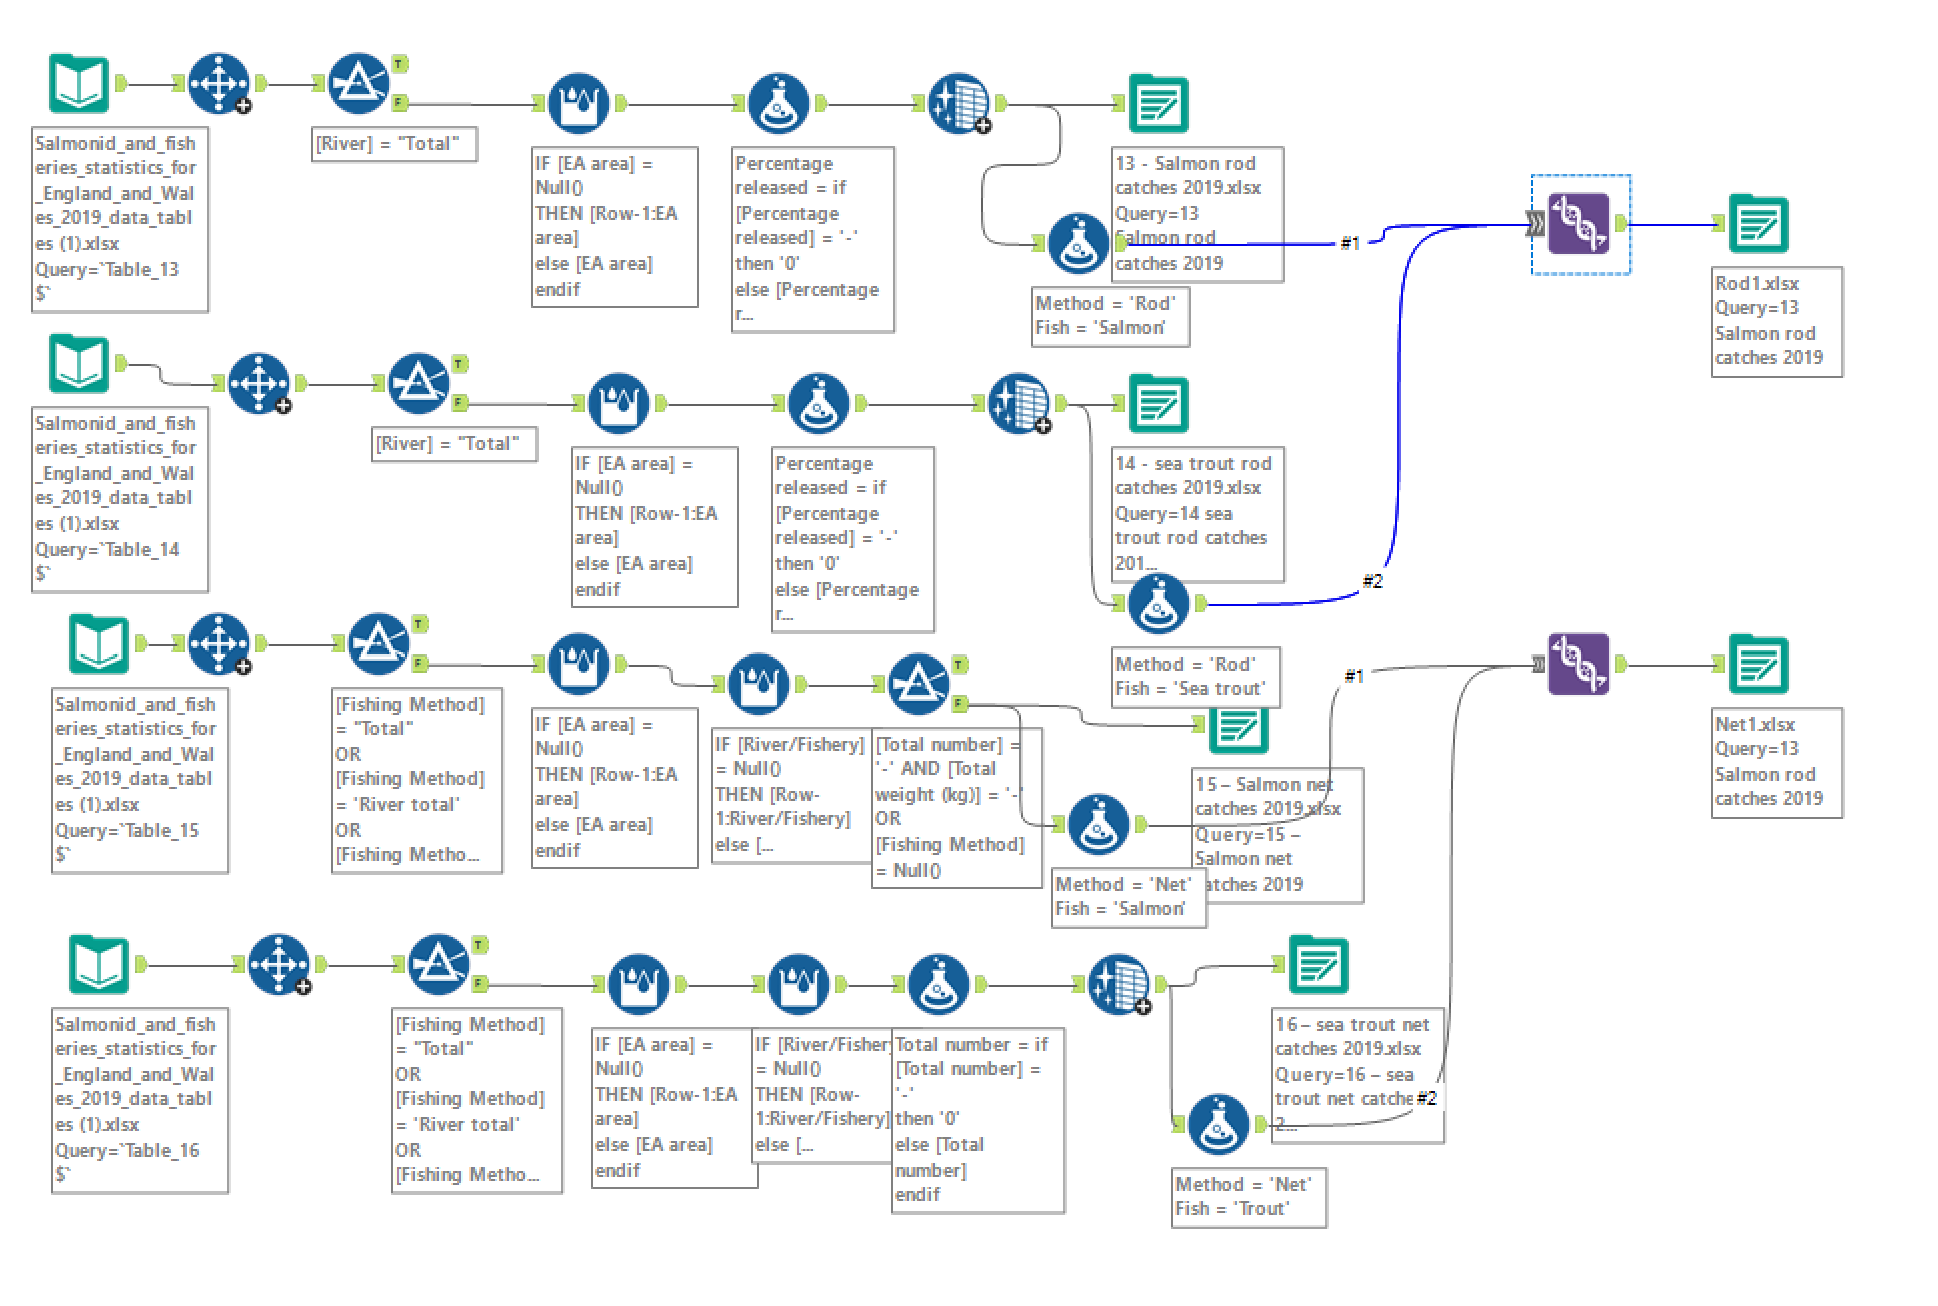
First idea – to have 4 files. After putting them to Tableau, I decided to union files by fishing method.
Then I spend too much time to find 'perfect' spatial data. Didn't go much further from it and decided to show what I already have in datasets.
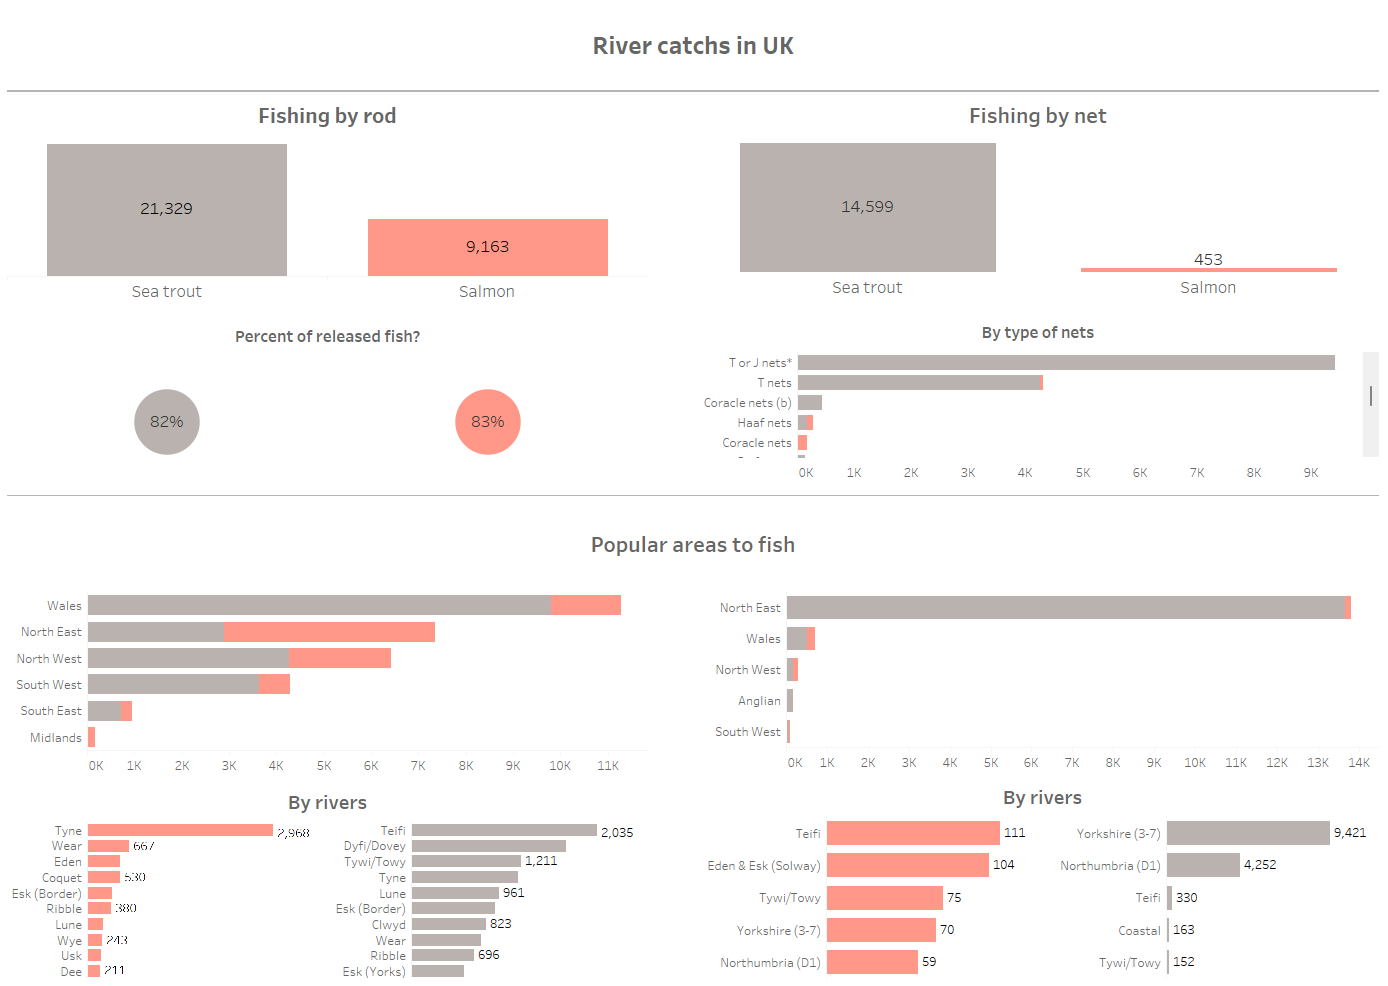
Idea to show overview data divided by types of catches and show difference between species.