


Dashboard week is upon us and for our first day with have been tasked with creating an Alteryx app to produce a data set that we can then feed into either a Tableau dashboard or a Power BI dashboard.
The app will be used to essentially filter an existing dataset containing information about crimes across the UK from March 2022 from March 2023, where you are able to select an area, a category; and a date range; all within the alteryx app.
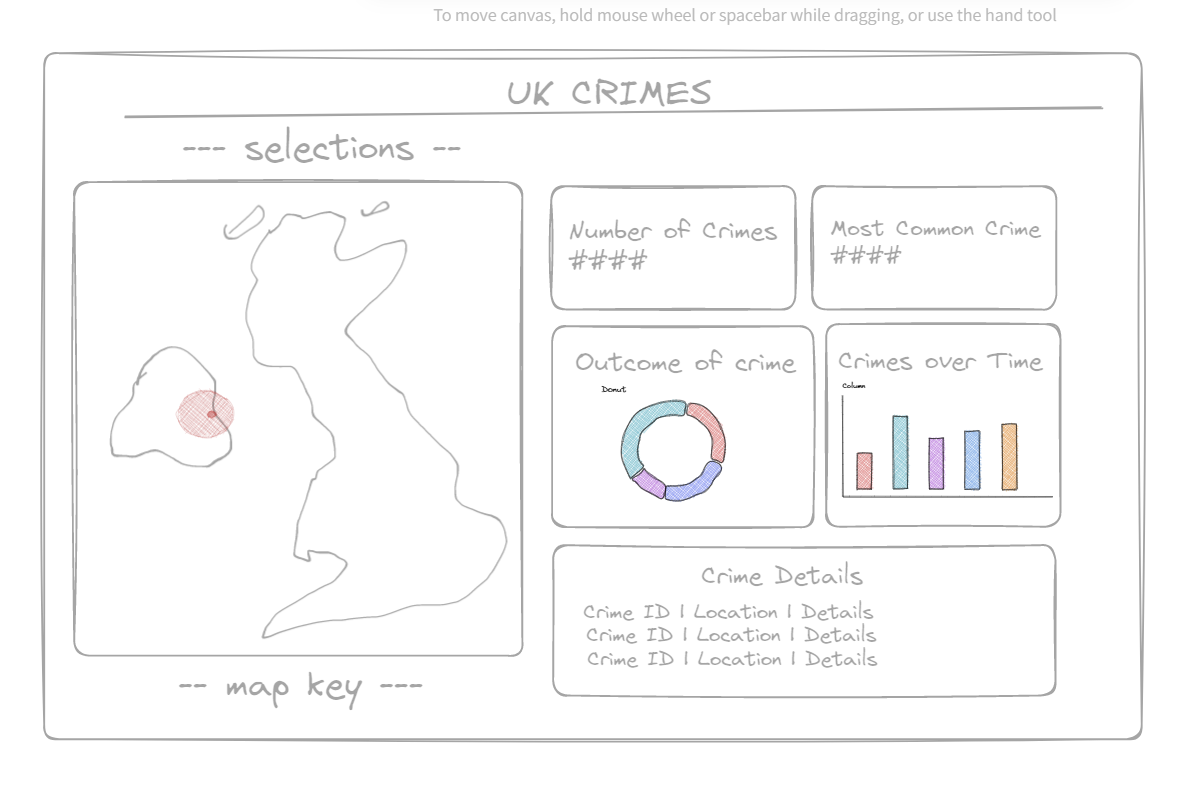
After having an initial look through the data so that I could get a vague idea of what fields I would have to work with I drew up an initial sketch.
Following this initial sketch I jumped right into Alteryx to begin making my app. Our instructions were pretty straightforward and I used our set set of steps to kind of direct my workflow. However, I came across a couple of hiccups while creating my app, including Alteryx crashing every time I tried to insert a map input tool, however this was solved by renaming a particular corrupted file in my program files so that Alteryx would boot up with a fresh one. Additionally, every so often my app would come up with null values despite working only minutes before, so navigating through that was also a bit bumpy.
After this, I went to Tableau desktop to begin creating my dashboard - I pretty much stuck to my initial sketch with a few changes, as I really wanted to have the map with all of the crimes as dots as a key focal point of the dashboard, and although this was to be a KPI dashboard in essence, I also definitely wanted to include a table of crime details in my bottom right - as if I am looking up crimes in my area, I definitely want further details in addition to the KPIs.