


Hello Reader,
The order of operations in Tableau is the order in which Tableau performs varying actions or operations. Many of which apply filters, this can mean you’ll need to add filters to a visualisation that you’ve made. Those filters are always processed in an established order.
Quick reminder of those filters:
Extract Filter:
- Filters data directly at the extract level, reducing the amount of data stored in the extract and improving performance by excluding unnecessary rows before data is imported into Tableau.
- Allows you to define specific criteria to include or exclude data from the extract based on dimensions, measures, or calculations.
Data Source Filter:
- Filters data at the data source level, affecting all workbooks and visualizations connected to that data source.
- Useful for applying consistent filtering logic across multiple workbooks or ensuring data security and compliance by restricting access to sensitive information.
Context Filter:
- Sets a specific order for applying filters in Tableau, ensuring that certain filters are applied before others.
- Useful when dealing with complex filter interactions, allowing you to control the filter precedence and optimize query performance.
Dimensions Filter:
- Filters data based on discrete fields that categorize data into distinct groups or categories.
- Allows you to include or exclude specific values or groups of values within dimensions, such as filtering by product categories or geographic regions.
Measures Filter:
- Filters data based on continuous numerical values, such as sums, averages, or counts.
- Allows you to define conditions for filtering aggregated data, such as filtering sales greater than a certain amount or filtering orders with specific quantities.
Table Calculations Filter:
- Applies filters dynamically based on the result of table calculations, which are calculations performed on the data displayed in a visualization.
- Allows you to create more flexible and interactive filtering conditions that change based on user interactions or changes in the visualization.
That list of filters is Tableau’s order of operations.
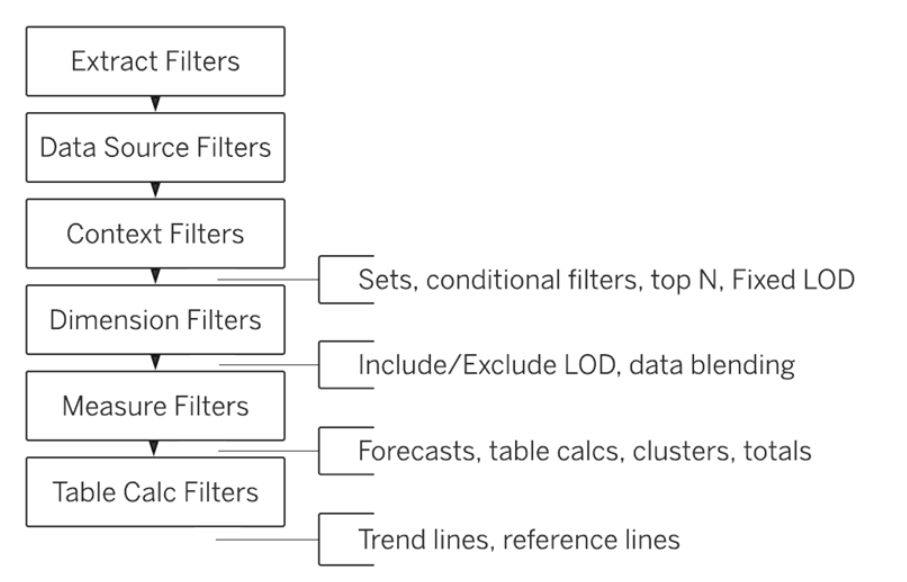
As this beautiful graphic details, this is the order of operations for your filters in terms of how they are processed! A handy a mnemonic I’ve used to recall this is: Every Data Schooler Can DM Tobias Colmer. Or you can fling me an email, and I’ll remind you the order of operations.