


Hello Reader,
Our brief for Day 2 was kindly a two day task (hence the sec A of the title), in which we must select data from the IMDb film list and create a dashboard on a topic of our choice! I selected Kill Bill & it's position against other titles within its genre.
I immediately learnt from the mistakes of yesterday, and kept well on track of my plan! This was namely, to have all graphs created and to spend tomorrow formatting, completing the majority of the technical aspects today and using tomorrow to construct the dashboard with the various visualisations that I've created.
Whilst on the topic of learning from my mistakes, I'll elaborate on the topic of my analysis (Kill Bill). Originally, during the LEGO dashboard of yesterday, I had so much data that things went haywire & I spent excessive time trying to salvage the values - this time, I've narrowed my scope to such an extent that I've had significantly less data quality / control problems. This has meant that I've been able to largely stick to my plan - which was constructed via my exploration of the data in-addition to my own creative wants of the brief.
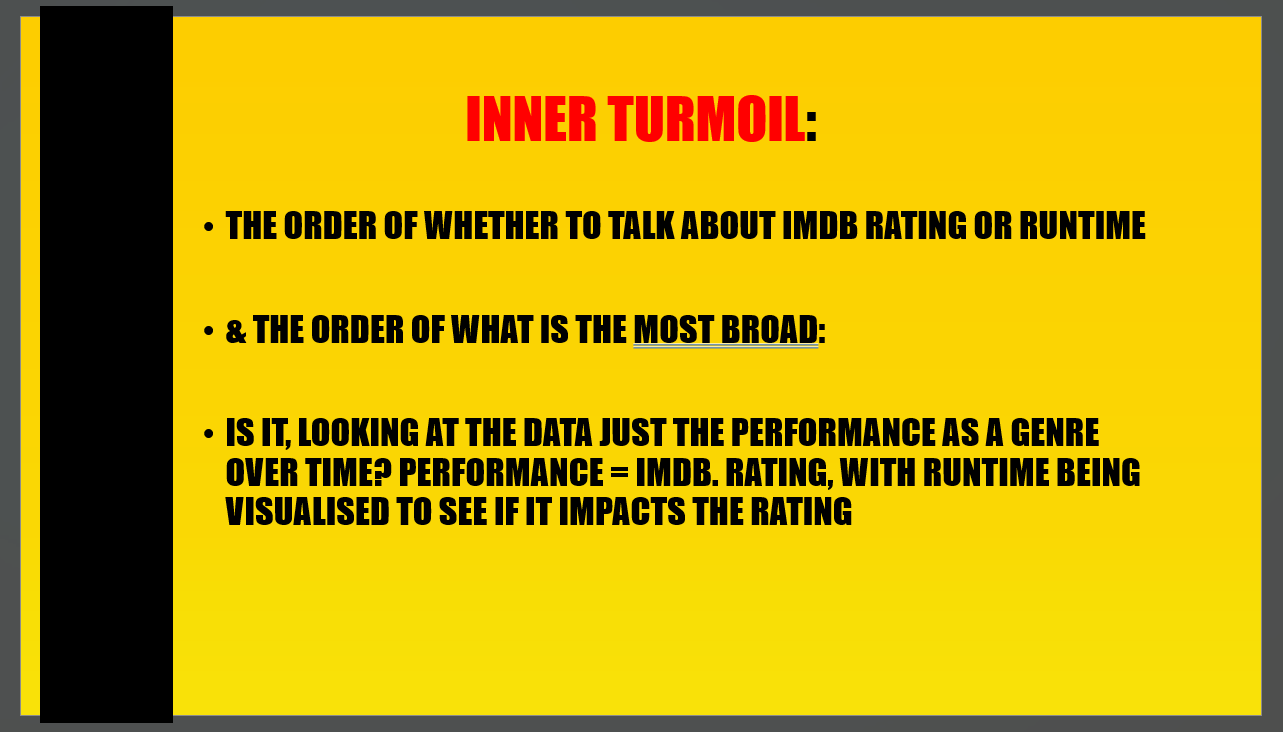
I had several iterations of how I wanted to present the data, but after enough planning I'd landed on the correct order of my visualisations & what was important to show at what time.
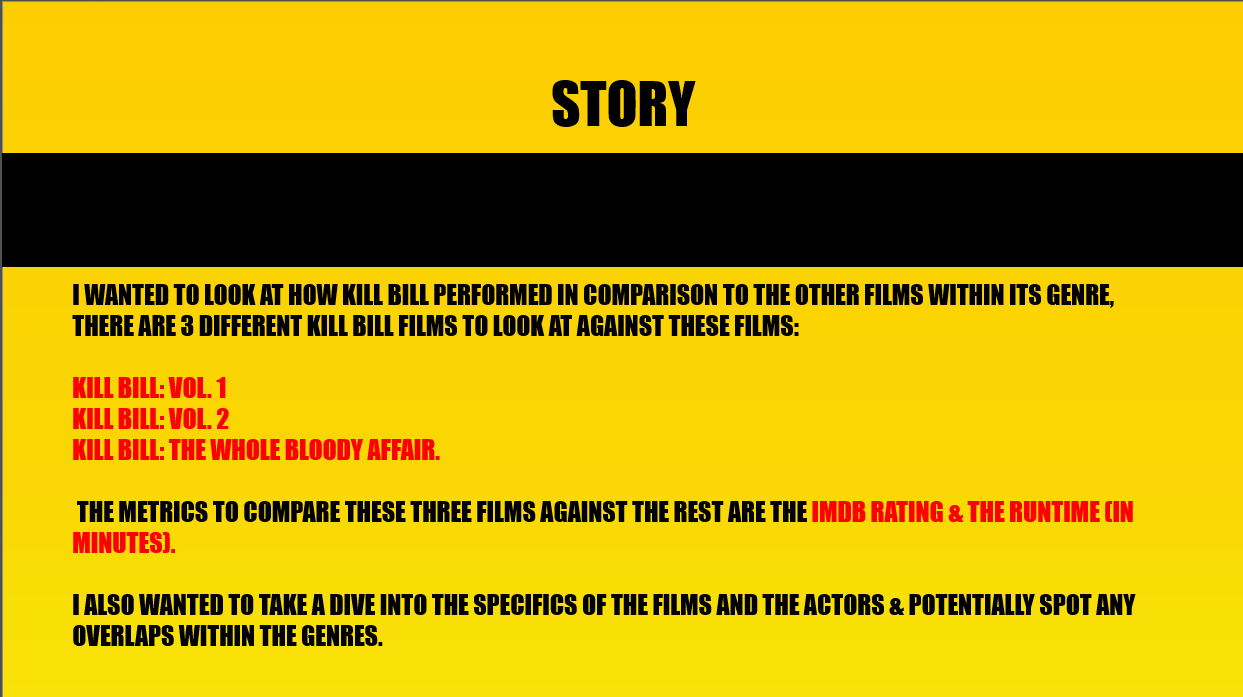
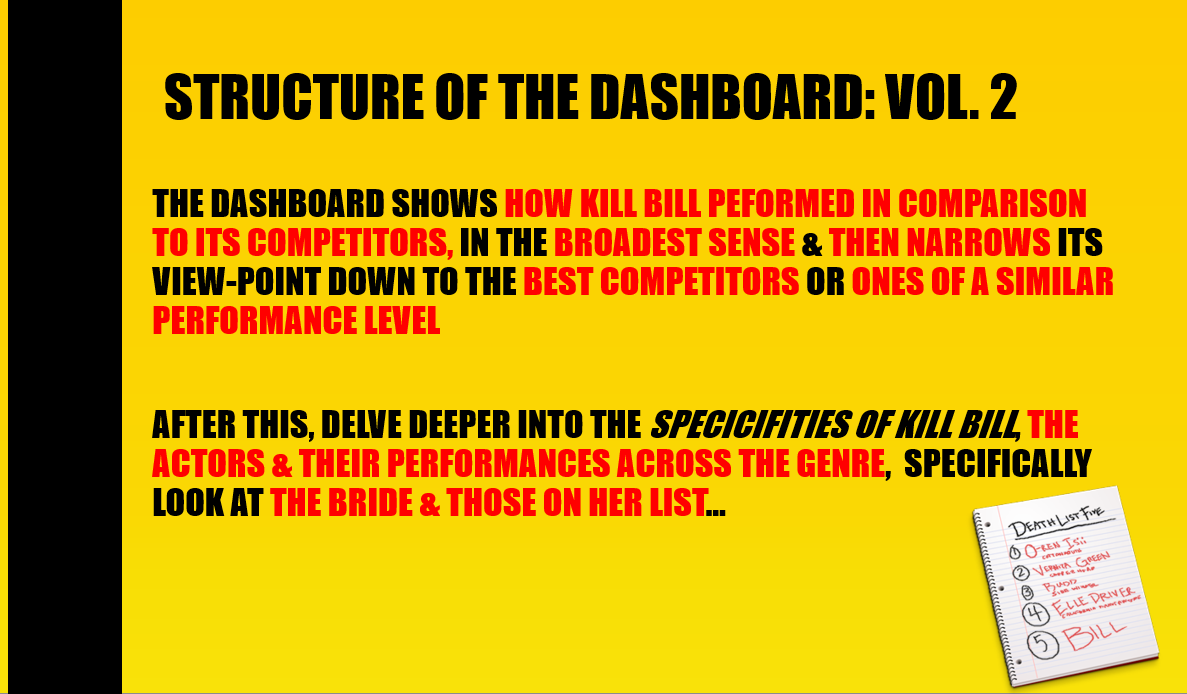
This was my story, and this is how I'm going to show it:
I won't mention the visualisations I'm using & why as that is for tomorrows blog, but the above should give a good idea, in-addition to a little nod toward a creative liberty I hope to take.
Take care reader, & see you tomorrow!