


Hello Reader,
Today was the first day of Dashboard week, with a charming brief on LEGO. It was a very fun day & the data was all contained within SQL.
This required some Joins to draw the data together:
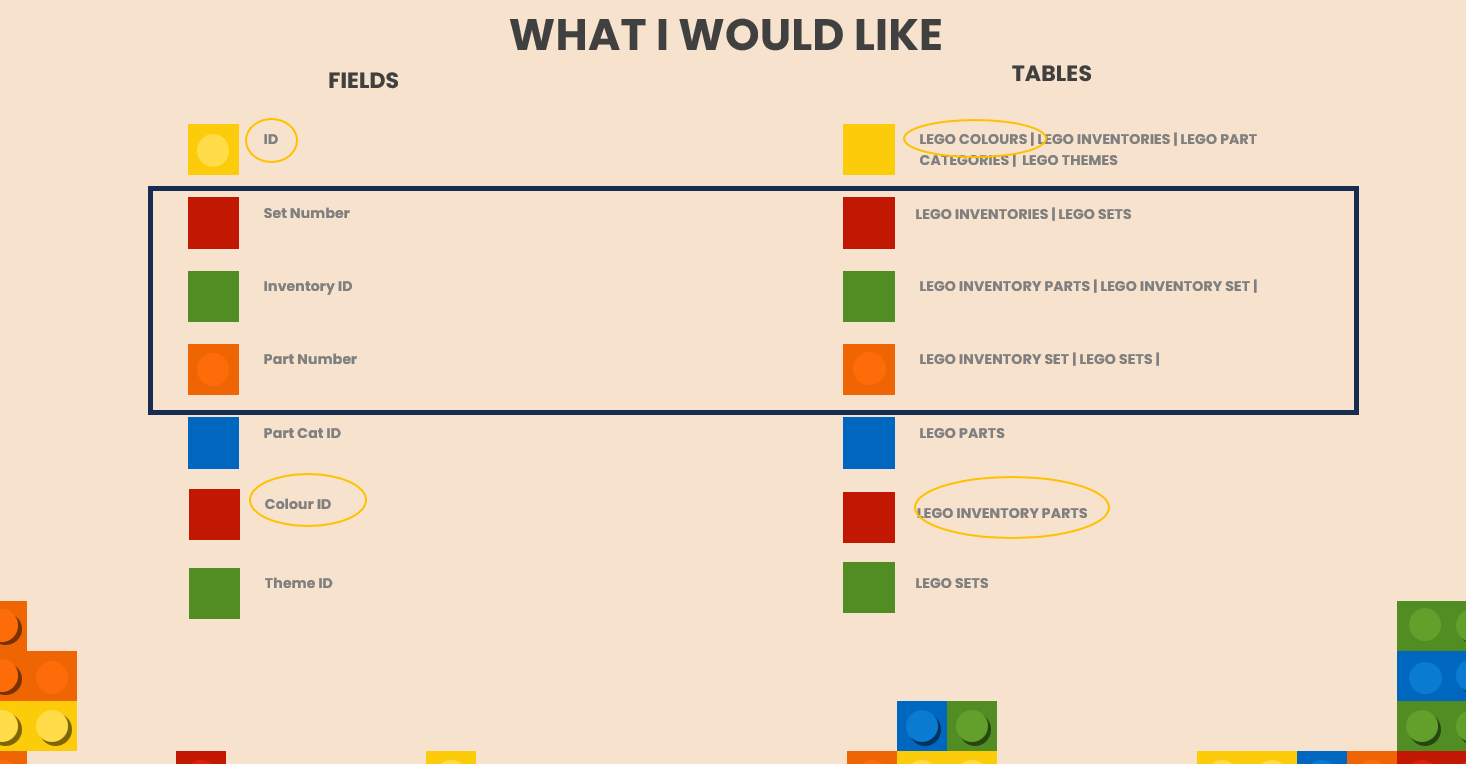
These were the IDs I had planned on using, with the yellow circles being adjustments after my plan.
These joins however resulted in a data confusion - leaving most values not correctly stating their true value.
Ultimately, my plan was a good one, and my PowerBI report was only a few steps from being complete. I needed to merge a date together, after splitting it apart in Power Query (the advent calendars contained the DAY & YEAR, and we know when advent calendar's are sold...).
My tips for Dashboard week and one that i'll bring into tomorrow, recognise the illusion of progress & ask for help faster. Though for the most part I was doing a great job, I only realised when it was too late that my data was in disrepair, and prioritised correcting the values over creating a place-holder of my work.
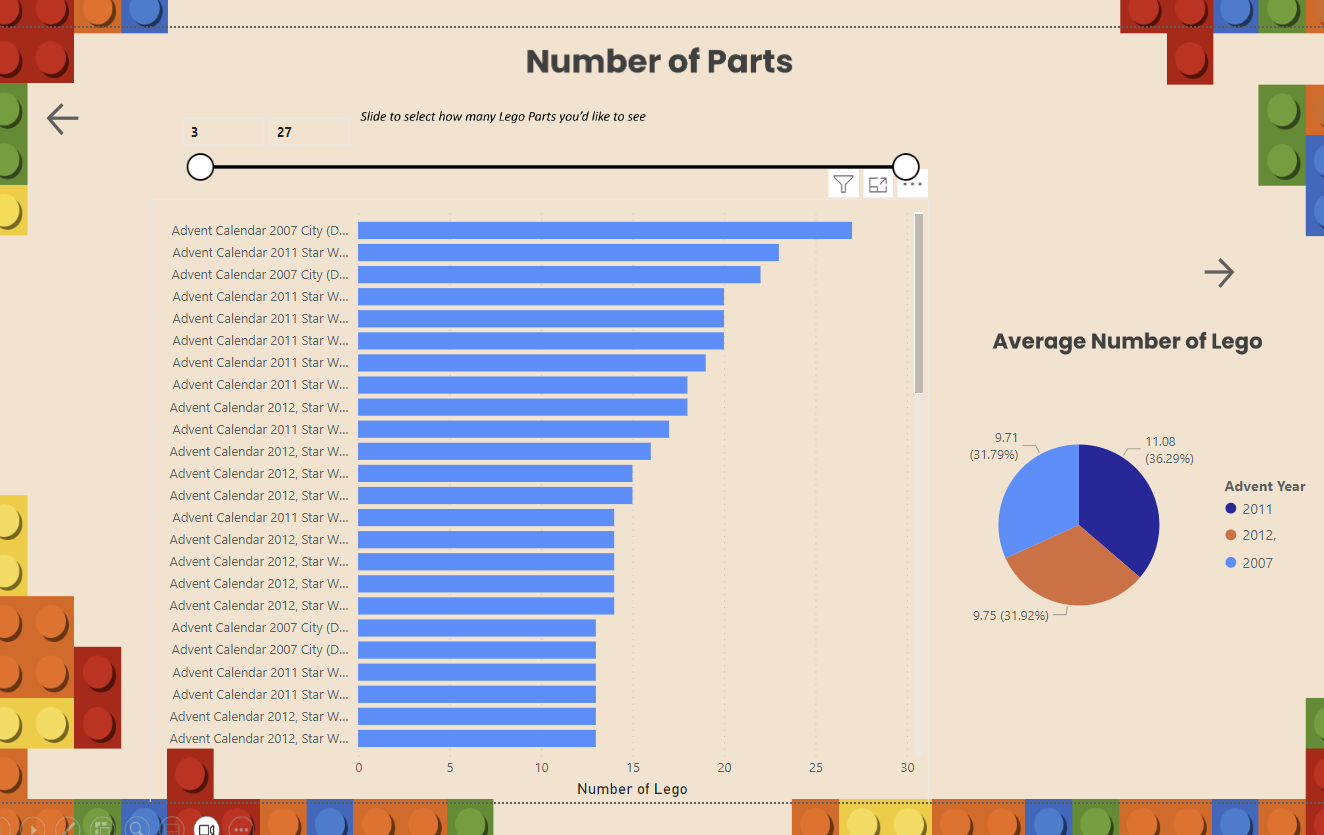
^ This is but one small part of my report, but with additional time I could've completed my line-chart & finessed and formatted my report.
Over the next few days, I will be reminding myself of this.
Thanks for reading.