This trick utilises tableau’s order of operations and where different calculations and filters interact and offers a way to dynamically show how many variables are in the view.
The trick in action
The scenario
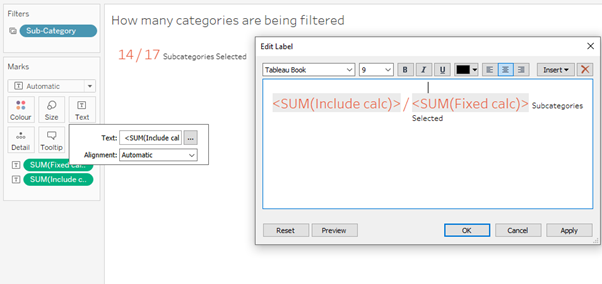
Lets say you want to look at a select few sub-categories in your data, but you also want the user to be aware that they are not looking at all the data and can see how many subcategories they are showing in the view.
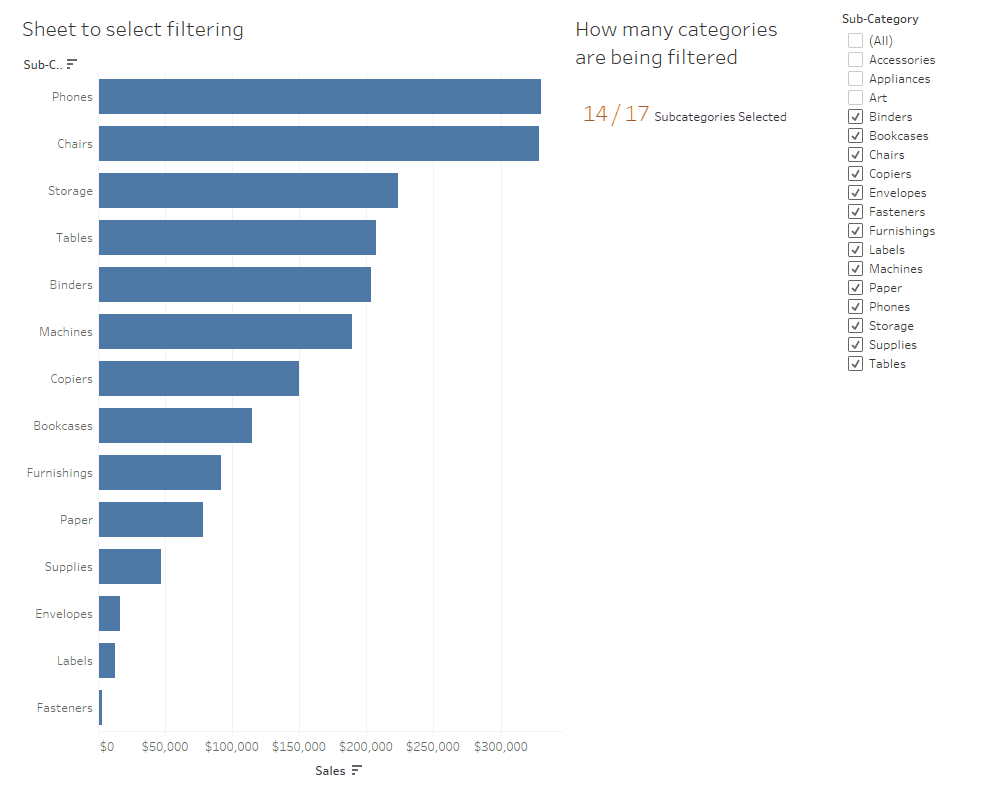
Firstly lets creates the chart looking at sales by subcategory. It might look something like this. Some sub-categories are shown in the view and others are not.
You’ll notice that the filter on the left hand side is a ‘blue pill’ this means its is a dimension filter, it could also be made a context filter by right clicking on it and adding it to context, however we don’t want to do that for this example.
Now we need to calculate two values, the number of subcategories in total and the number of subcategories currently selected. This is where the order of operations comes in.
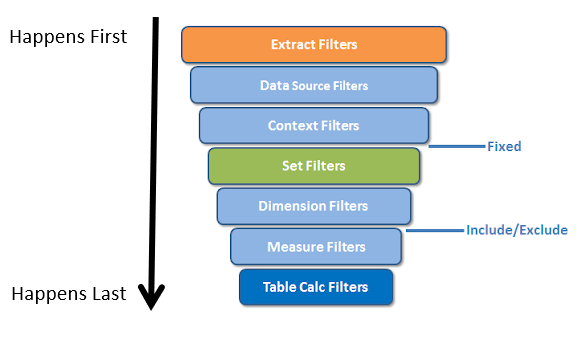
The diagram above shows the order of operations in tableau. You’ll notice the words ‘Fixed’ and ‘Include/Exclude’ outside of the boxes on the right hand side, these are the different, Level Of Detail or LOD, calculations. The blue lines show where in the order of operations these calculations take place. What’s key to our use case is that ‘Dimension filters’ which are the blue filters take place after fixed calculations and before Include/Exclude calculations. With this in mind let’s make some calculations in a new sheet.
The Calculations
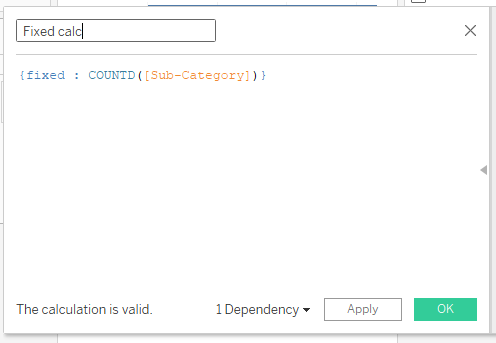
The picture above shows a fixed calculation which is fixed on nothing, so it looks across the entire dataset and finds how many unique subcategories there are. This will disregard the filtering done as it acts before the dimension filter.
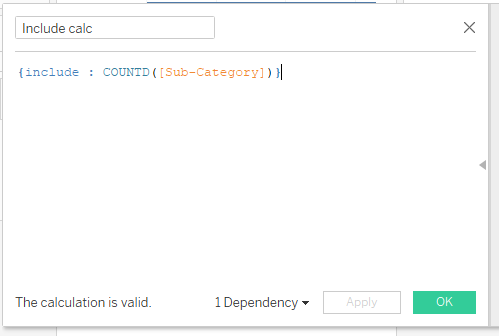
The picture above is an include calculation, again it is fixed on nothing so it looks across the entire dataset and finds how many unique subcategories there are. This will take into account the filters which are being filtered out, so as we include fewer subcategories, the value provided by this calculation will decrease.
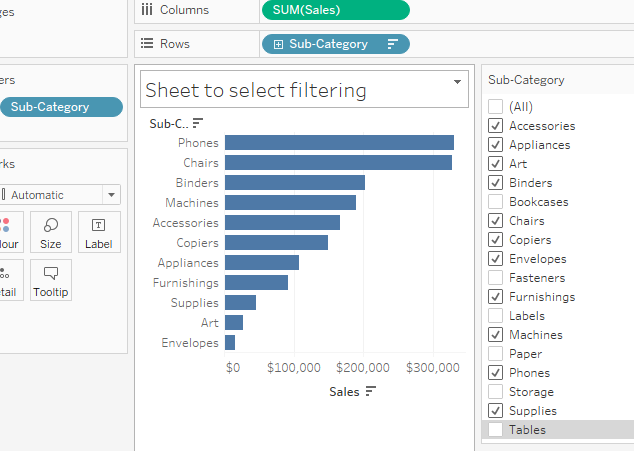
You can then place these calculations onto the text shelf a sheet that has the same filter acting on it and the value will dynamically update when you select/deselect categories.
That’s all from me, I hope you found the tip useful and can see how taking advantage of tableau’s order of operations can be useful in certain examples. If you find any cool use cases, by all means let me know, I’d love to hear about it! I can be found @thenumberstim on twitter.
Cheers for reading (^///^)