This post is based on a chart I made for this week’s Makeover Monday, based on projected age data about the US population. After reading it, you should be able to create individual reference bands for every pane in your view.
The Problem
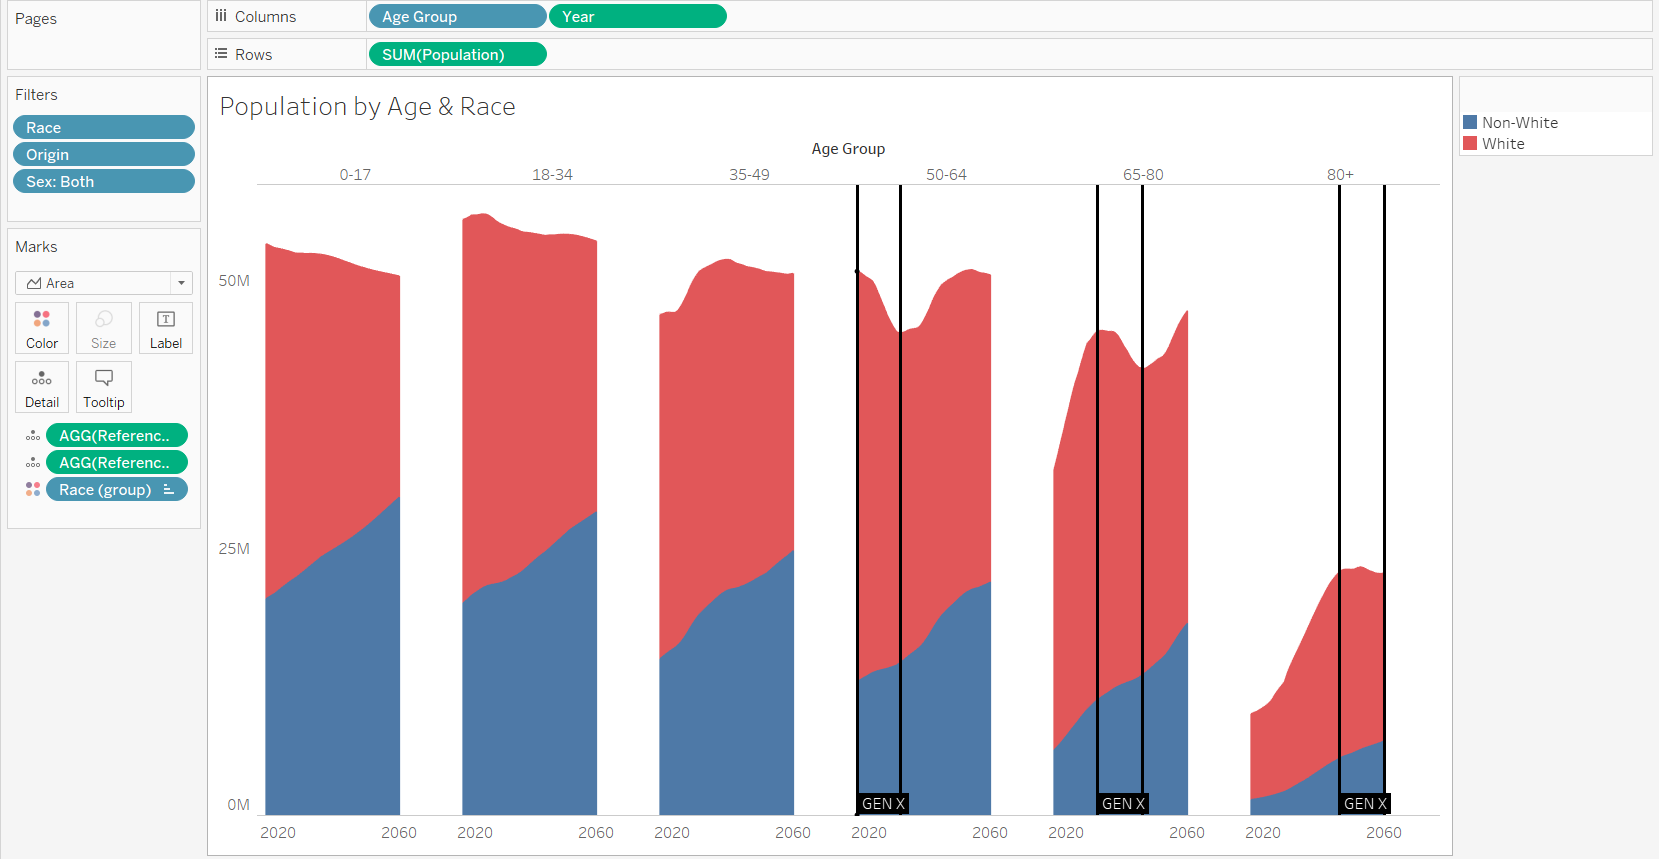
Playing with different ways to display the data I found something fairly interesting. I created age groups and displayed the estimated population by age group by year between 2016 and 2060, as follows:
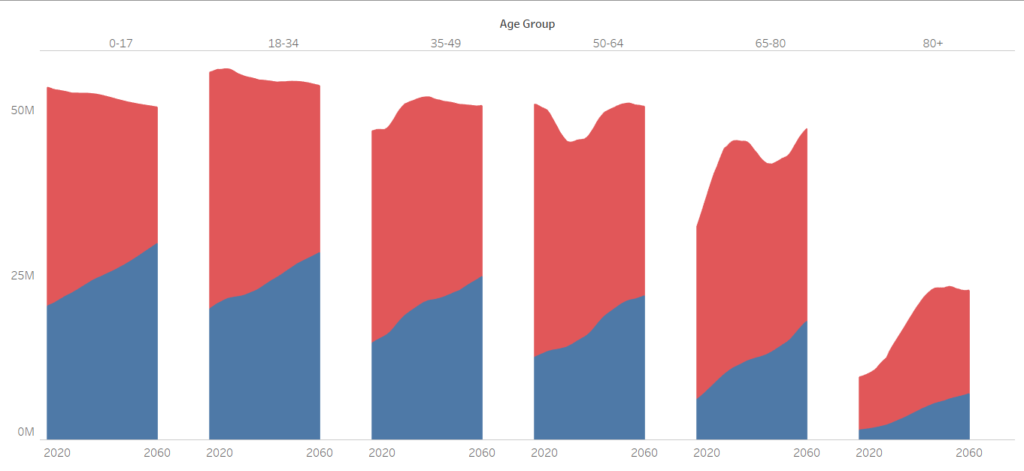
The colours mark white vs. non-white.
One anomaly stands out pretty much immediately. There is a clear dip in the area charts for two age groups, 50-64 and 65-80, respectively. Also, we can see that the steep curve flattens out for the 80+ age group. The reason for the dip is the falling birth rate that is commonly associated with Generation X.
There are many competing definitions of this generation and who belongs to it. Without making this a sociological essay, I defined Generation X as those born between 1965 and 1980. This means that the first members of Gen X would fall into the 50-64 age group in 2015, the last members in 2030. In turn, the same would happen for the 65-80 age group in 2030 and 2045, respectively, and again for the 80+ age group with 2045 and 2060. I wanted to highlight those three separate time frames to allow the user to track Generation X as it passes through the three age groups.
The Solution
I would need to create reference bands with different values for each pane, showing three time frames ranging from 2015 to 2030, from 2030 to 2045 and from 2045 to 2060. Here is my take:
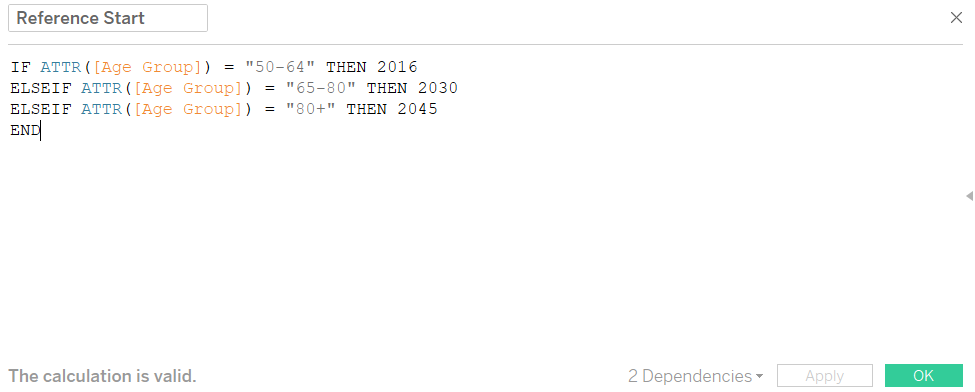
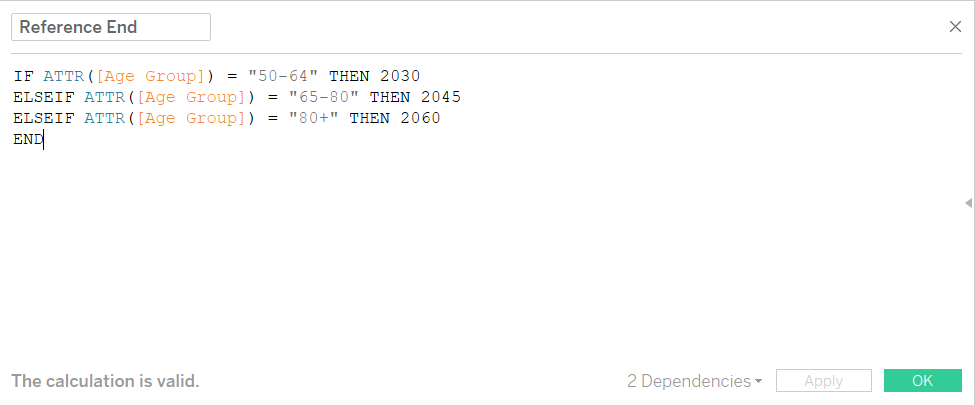
1. I created two calculated fields which I named Reference Start and Reference End.

These should really be the other way round…
They contain a function that returns the appropriate start or end year depending on age group of the respective pane. That way I defined three start years and three end years (I selected 2016 rather than 2015 because that is where the dataset starts).
I dropped those two calculations on the detail shelf.
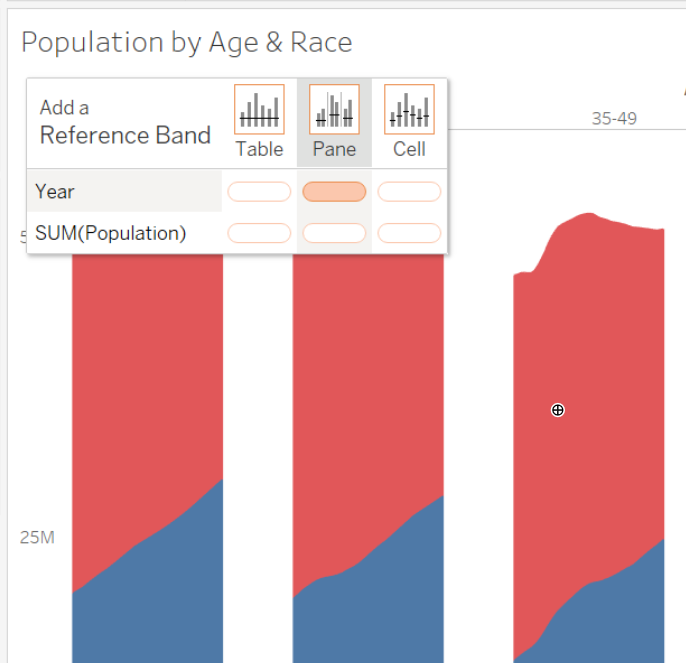
2. I then dragged in a reference band from the Analytics pane and set it per pane, per year.
3. In the editor, I selected my calculated fields as the minimum and maximum values. (I chose Minimum and Maximum as mode of aggregation, Total/Median work, as well.)
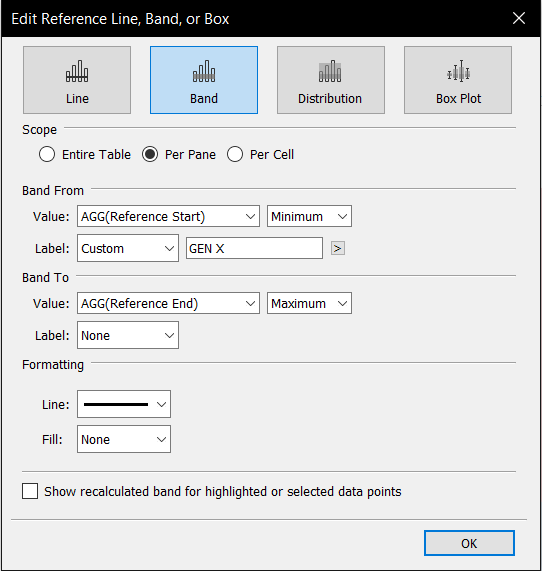
4. This gave me my reference bands. But here is one of those things where Tableau likes to act a bit weird: It draws bands behind marks, so that the shaded band is hidden behind the area chart unless you lower the opacity, which still won’t look ideal. However, lines are drawn in front, so I got rid of the filling entirely and opted for lines instead, which I think creates a more orderly feel.
Done! Here is a link to the interactive viz on Tableau Public.