So dashboard week has come to an end, and i approximate these 5 days have aged me around 20 years. Today’s data set was from Gapminder and contained data on, birth rates, life expectancy, C02 emissions, child mortality and income. Overall, the data was very interesting and there were a lot of interesting insights to find – so it was a shame we had so little time to explore it!
Keeping to the time constraints has always been an issue for me during my time at the data school and the final day of DW was no different. Having half the time we usually get, i tried to focus my analysis initially on life expectancy of countries involved in WW1. However i scrapped this as i had an idea to look at Chinese birth rates and how implementation of policies such as the one child policy affected this.
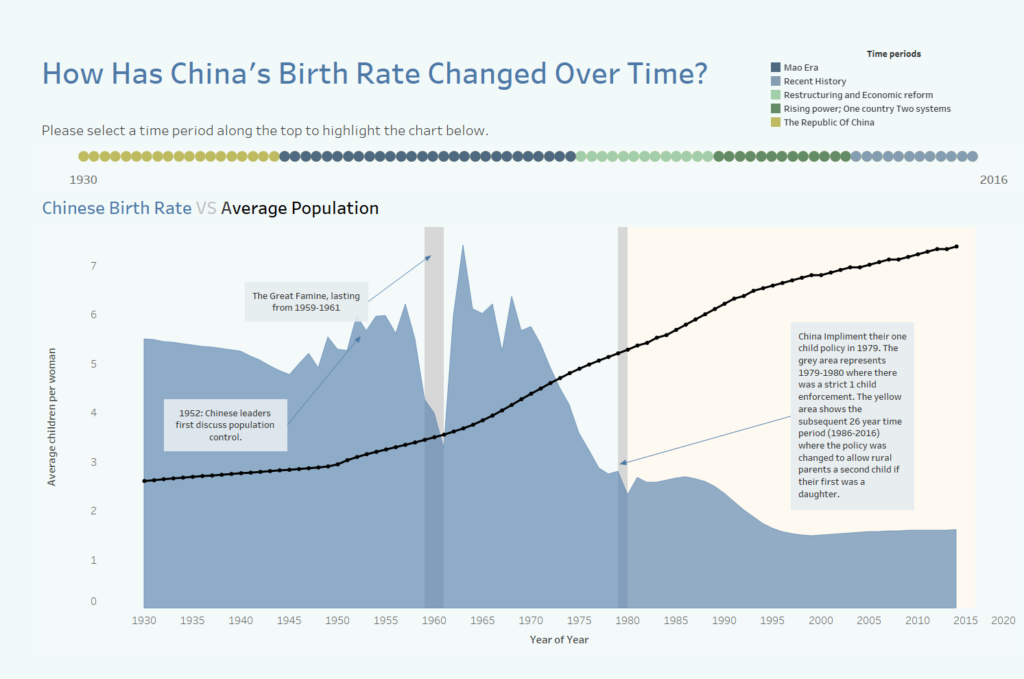
Changing tack halfway through an already short day was probably not the smartest move – and sadly my final dashboard wasn’t the end product i hoped for. I tried to incorporate time periods of Chinese history (such as the Mao era) into the above line chart, with the aim of users being able to select a period along and for this to highlight the chart below. However for the life of me i could not get this action working (if anyone knows why please send help!).
Anyway here is my final dashboard: