In this tableau tip I’m going to show you how to create dots at the end your line graph using the Superstore Sales data in this example:
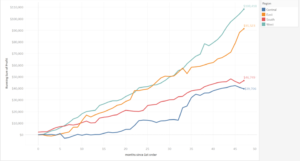
A Line Graph is one of the most frequently used graphs to show trends and analyse how the data has changed over time. When you have several lines in your graph (other data series), individual lines can be compared to one another. Line graphs are one of the best ways used to track changes over time since it includes equal intervals of time between each data point such as analysing profit over time, this is dependent on using continuous data. However, sometimes this can be quite overwhelming for the user viewing it which is why adding a dot at the end of your line allows your user who is looking at your line graph to quickly identify lines and the corresponding labels instead of referencing a key.
There is a really simple way to create this without any calculations or IF statements.
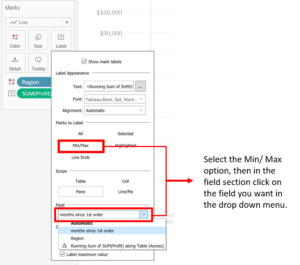
Make sure you untick the option: ‘label minimum value’ and you’re done!