For dashboard week: day 1 we had to web scrape the results table of the Prudential ride London from their official site: https://results.prudentialridelondon.co.uk
The first step was to be able to download and access the data was to use Alteryx and build a workflow which Alexender wrote a post about: here
An interesting challenge we had was that the results table was in 1,115 different pages and we wanted to download them all.
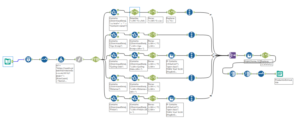
First Step: We cleaned the data for the 1st page of data using regex and data preparation tools.
Second Step: After cleaning the data what you want to do next is download all the other pages, it’s easy to do this using the generate rows tool: create a new field and set the row count from 1 to the maximum number amount of pages you have, remember to only increment by +1; so you don’t miss any pages. Following, this you add your new row count field to your URL like this: “https://results.prudentialridelondon.co.uk/2018/?page=”+[RowCount]
Extra tip: Make sure you don’t have a space between the plus sign and your row count.
This gave us the data for all of our pages in a quick and easy manner!
The next stage was analysing and visualising the data in Tableau. I personally don’t know much about biking or what the Prudential are so I did some reading on their website: here
It was interesting finding out that this is an event that gets so many people involved from all over the world. This got me interested in discovering more about the demographic analysis of the riders. I was intrigued about where the riders were from, age and gender breakdown and allowing users to explore cyclist by demographic and how far in terms of distance miles travelled and hours did they accomplish.
You can explore my data visualisation here