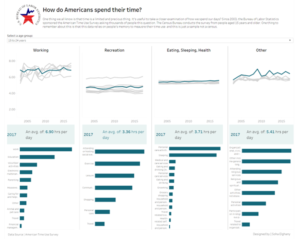
How do Americans spend their time was our dataset this week from Andy Kriebel since 2003, the Bureau of Labor Statistics sponsored the American Time Use Survey who asked thousands of people aged from 15 years and older the question: How do you spend your time?
One thing to remember about this is that this data relies on people’s memory to measure their time use and this is just a sample, not a census.
So how did I get the data: I did it through alteryx where I first did web scraping I used this site American time use survey provide their data in public using this link: https://download.bls.gov/pub/time.series/tu/
Everything is coded here:
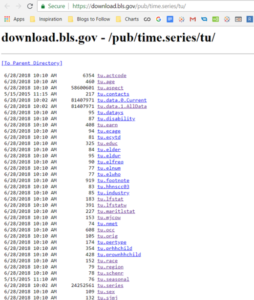
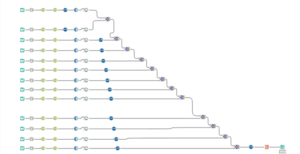
It was possible to download the main table however the issue with it is all the values are coded for each column. To decode these you have to download the other separate links for the data you are interested in and join in back to the main table this was done through Alteryx:
After this, I had to visualise the data I chose to visualise it by grouping the activities into broader categories and underneath showing a drill down of those categories. I used a parameter to allow for a comparison of how much time difference age groups spend on certain activities every day: you can explore my visualisation here