As Benedetta has already anticipated in her blog post, I am going to write about Time Series tools in Alteryx.
But, what does “time series” mean? Let’s start with a definition: A time series is simply a sequence of numbers collected at regular intervals over a period of time.
I have found this training video very useful for understanding the basis for time series tool in Alteryx, which Benedetta and I succeded to apply for a project.
In particular, I will focus on:
- How to build an ARIMA and ETS time series model and how to compare them
- After having choosen the model, how to apply a model to the current data to predict the future
ARIMA & ETS Time series model: what are they?
- ARIMA TOOL: It estimates a time series forecasting model, either as a univariate model or one with covariates (predictors), using an autoregressive integrated moving average (or ARIMA) method, the most commonly used forecasting approach.
- ETS TOOL: It estimates a univariate time series forecasting model using an exponential smoothing method, a commonly used forecasting approach based on a weighted average of past observations, with the weights declining in size for more distant past values.
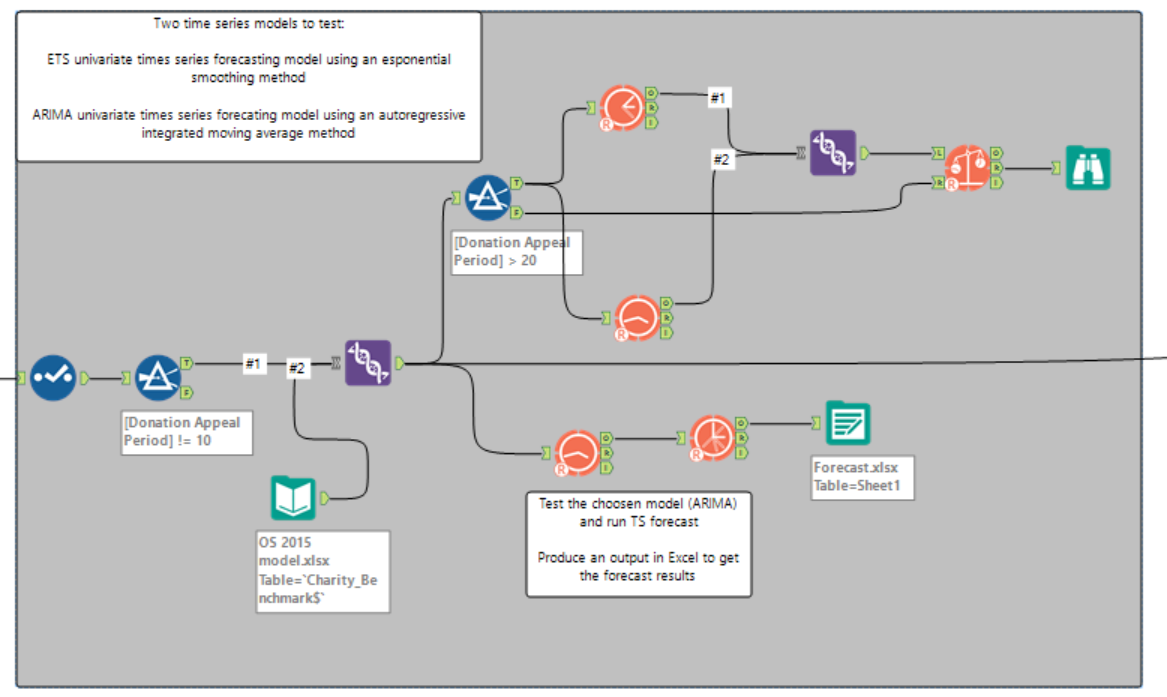
FIRST STEP
How to build an ARIMA and ETS time series model and how to compare them
- Use a filter to split the data into 2 sets (with a condition over the number of months in the dataset in my case)
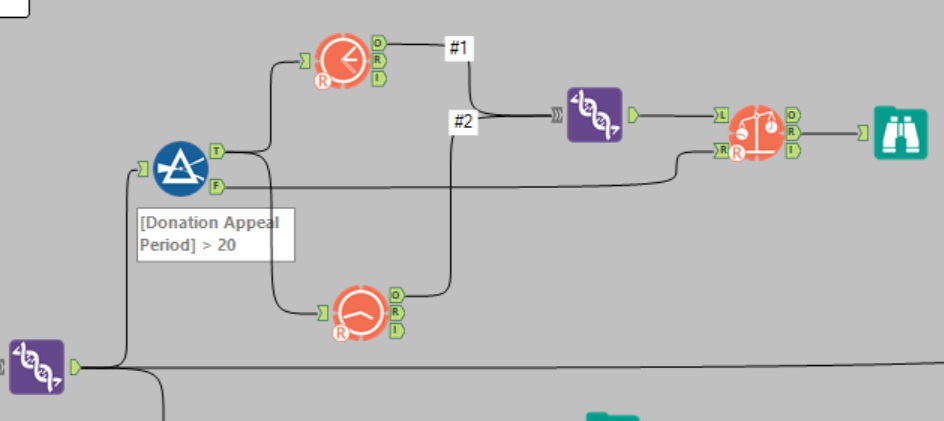
- Connect ARIMA and ETS models to the filter on the true side and configure the tools:
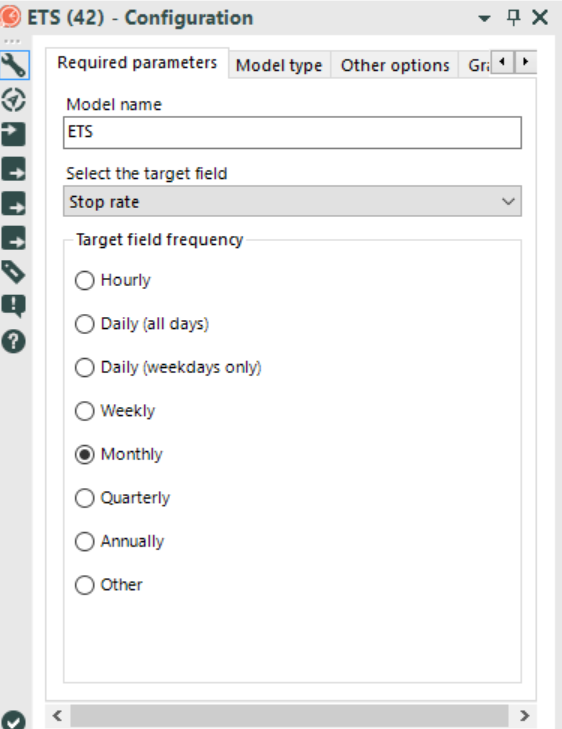
- Insert the model name
- Select the target field – the field you will need to predict (in my case the stop rate)
- Select the field frequency (in my case monthly)

- Do not forget to use the union tool to union them
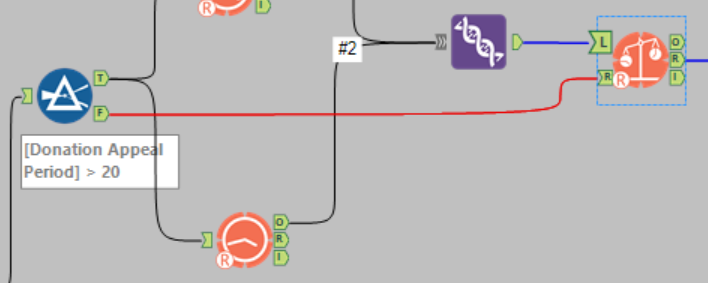
- Use the TS Compare tool in order to check which time series model would be better to implement:
- In the left side put the union from the two models, while in the right side put the False from the filter
- Put a Browse tool in R (Report) in order to see the Report result
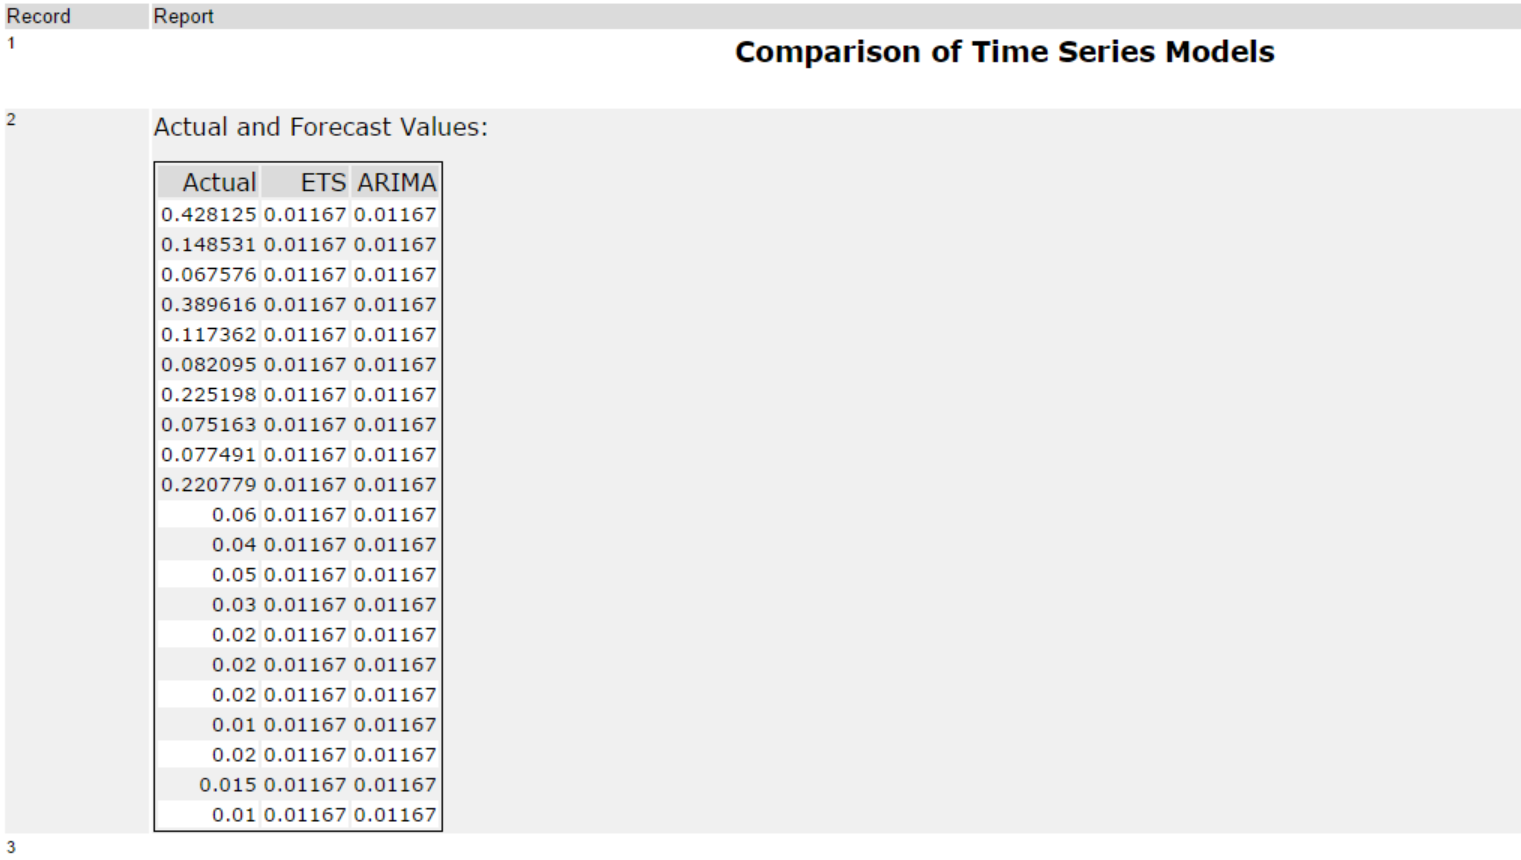
- Check the values and also the graph in the report
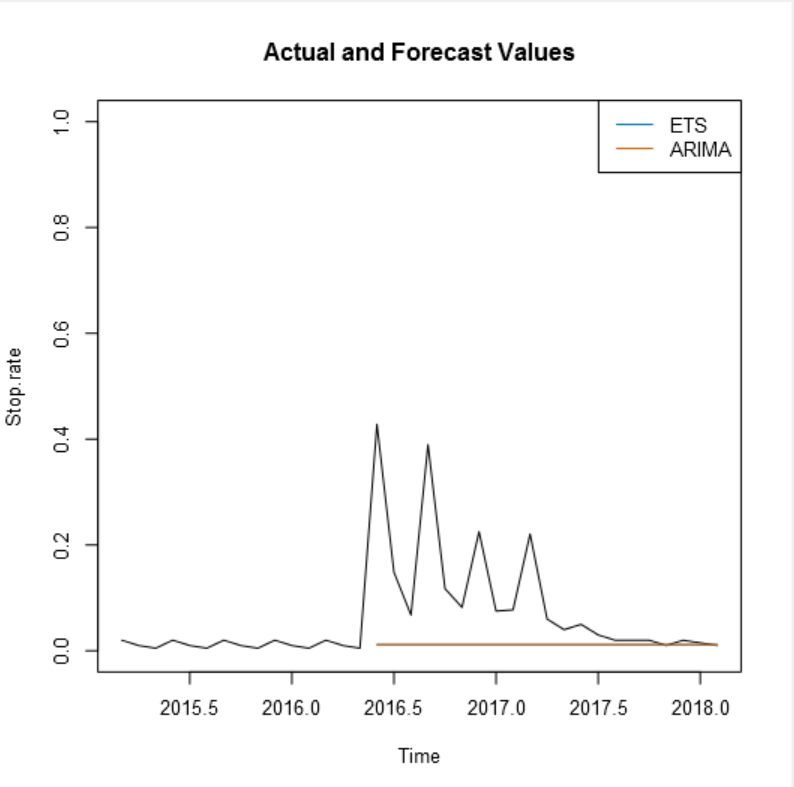
In this specific case the view into the graph is quite flat, that means that both the models could be choosen: I have choosen then the ARIMA Model.
SECOND STEP
After having choosen the model, how to apply a model to the current data to predict the future
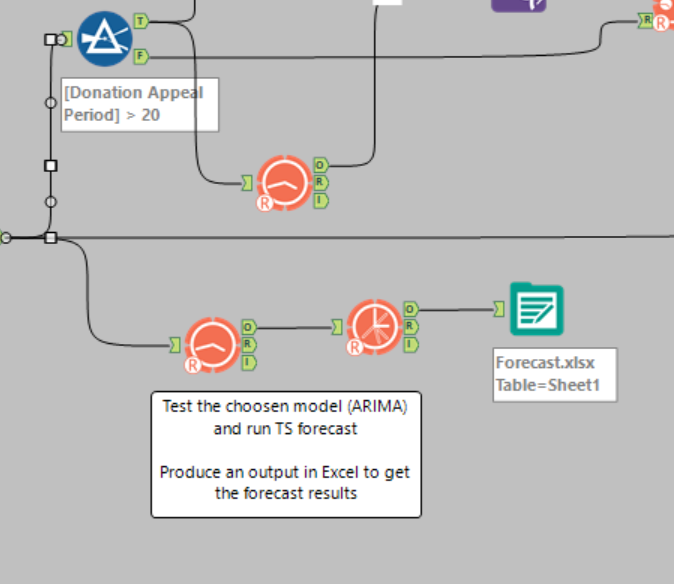
- Use the ARIMA Model tool (the choosen one)
- Configure it again (same options as before but with a new name)
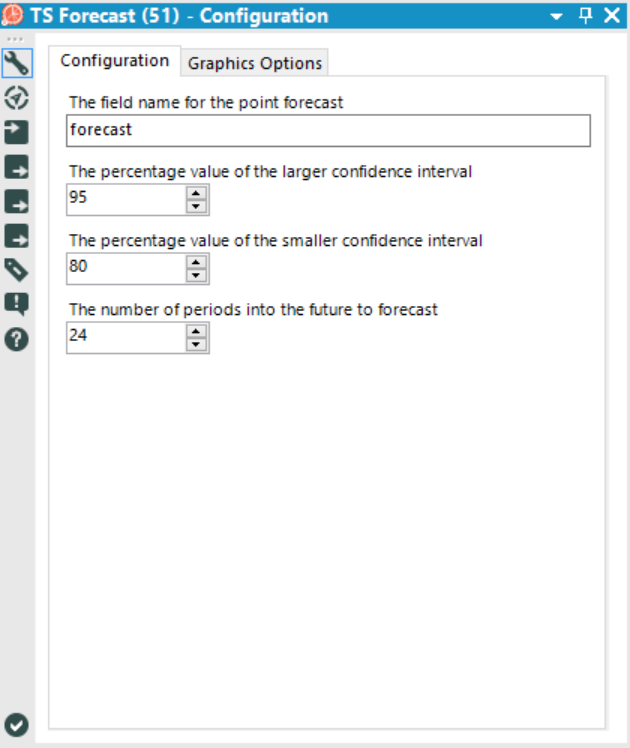
- Use a TS Forecast tool in order to generate the prediction on stop rate for the next 24 months
- Insert a browser tool or an output tool in order to check your final prediction.
I hope you have found this post useful. If you have any questions or doubts do not hesitate to ask.
A presto!