I am still confused about how to call this week: should it be week 8 or week 10? Christmas holidays have generated confusion.
Anyway, this week has been quite tough for me in terms of organizing my time but really exciting.
Starting from:
- Monday: exam practice with Andy
- Tuesday: Tableau exam & intro to the weekly project (airline delays)
- Wednesday: infographic & data viz training (amazing session!!!) and a bit of working on projects
- Thursday: Tableau experience in Milan for me
- Friday: viz of time and working on projects in order to do the presentations
MONDAY
Andy helped us to go through the preparation exam guide and we made a lot of useful exercises. I also decided to remake the exam practice he gave us to do the week before.
TUESDAY
Exam day, passed! After the exam, Andy introduced us to the weekly project about airline delays. The challenge was collecting all the datasets (divided by months, we needed to download one by one, but thanks to Alteryx we solved this issue). We started data prep but still I did not have yet an idea of what I wanted to do.
WEDNESDAY
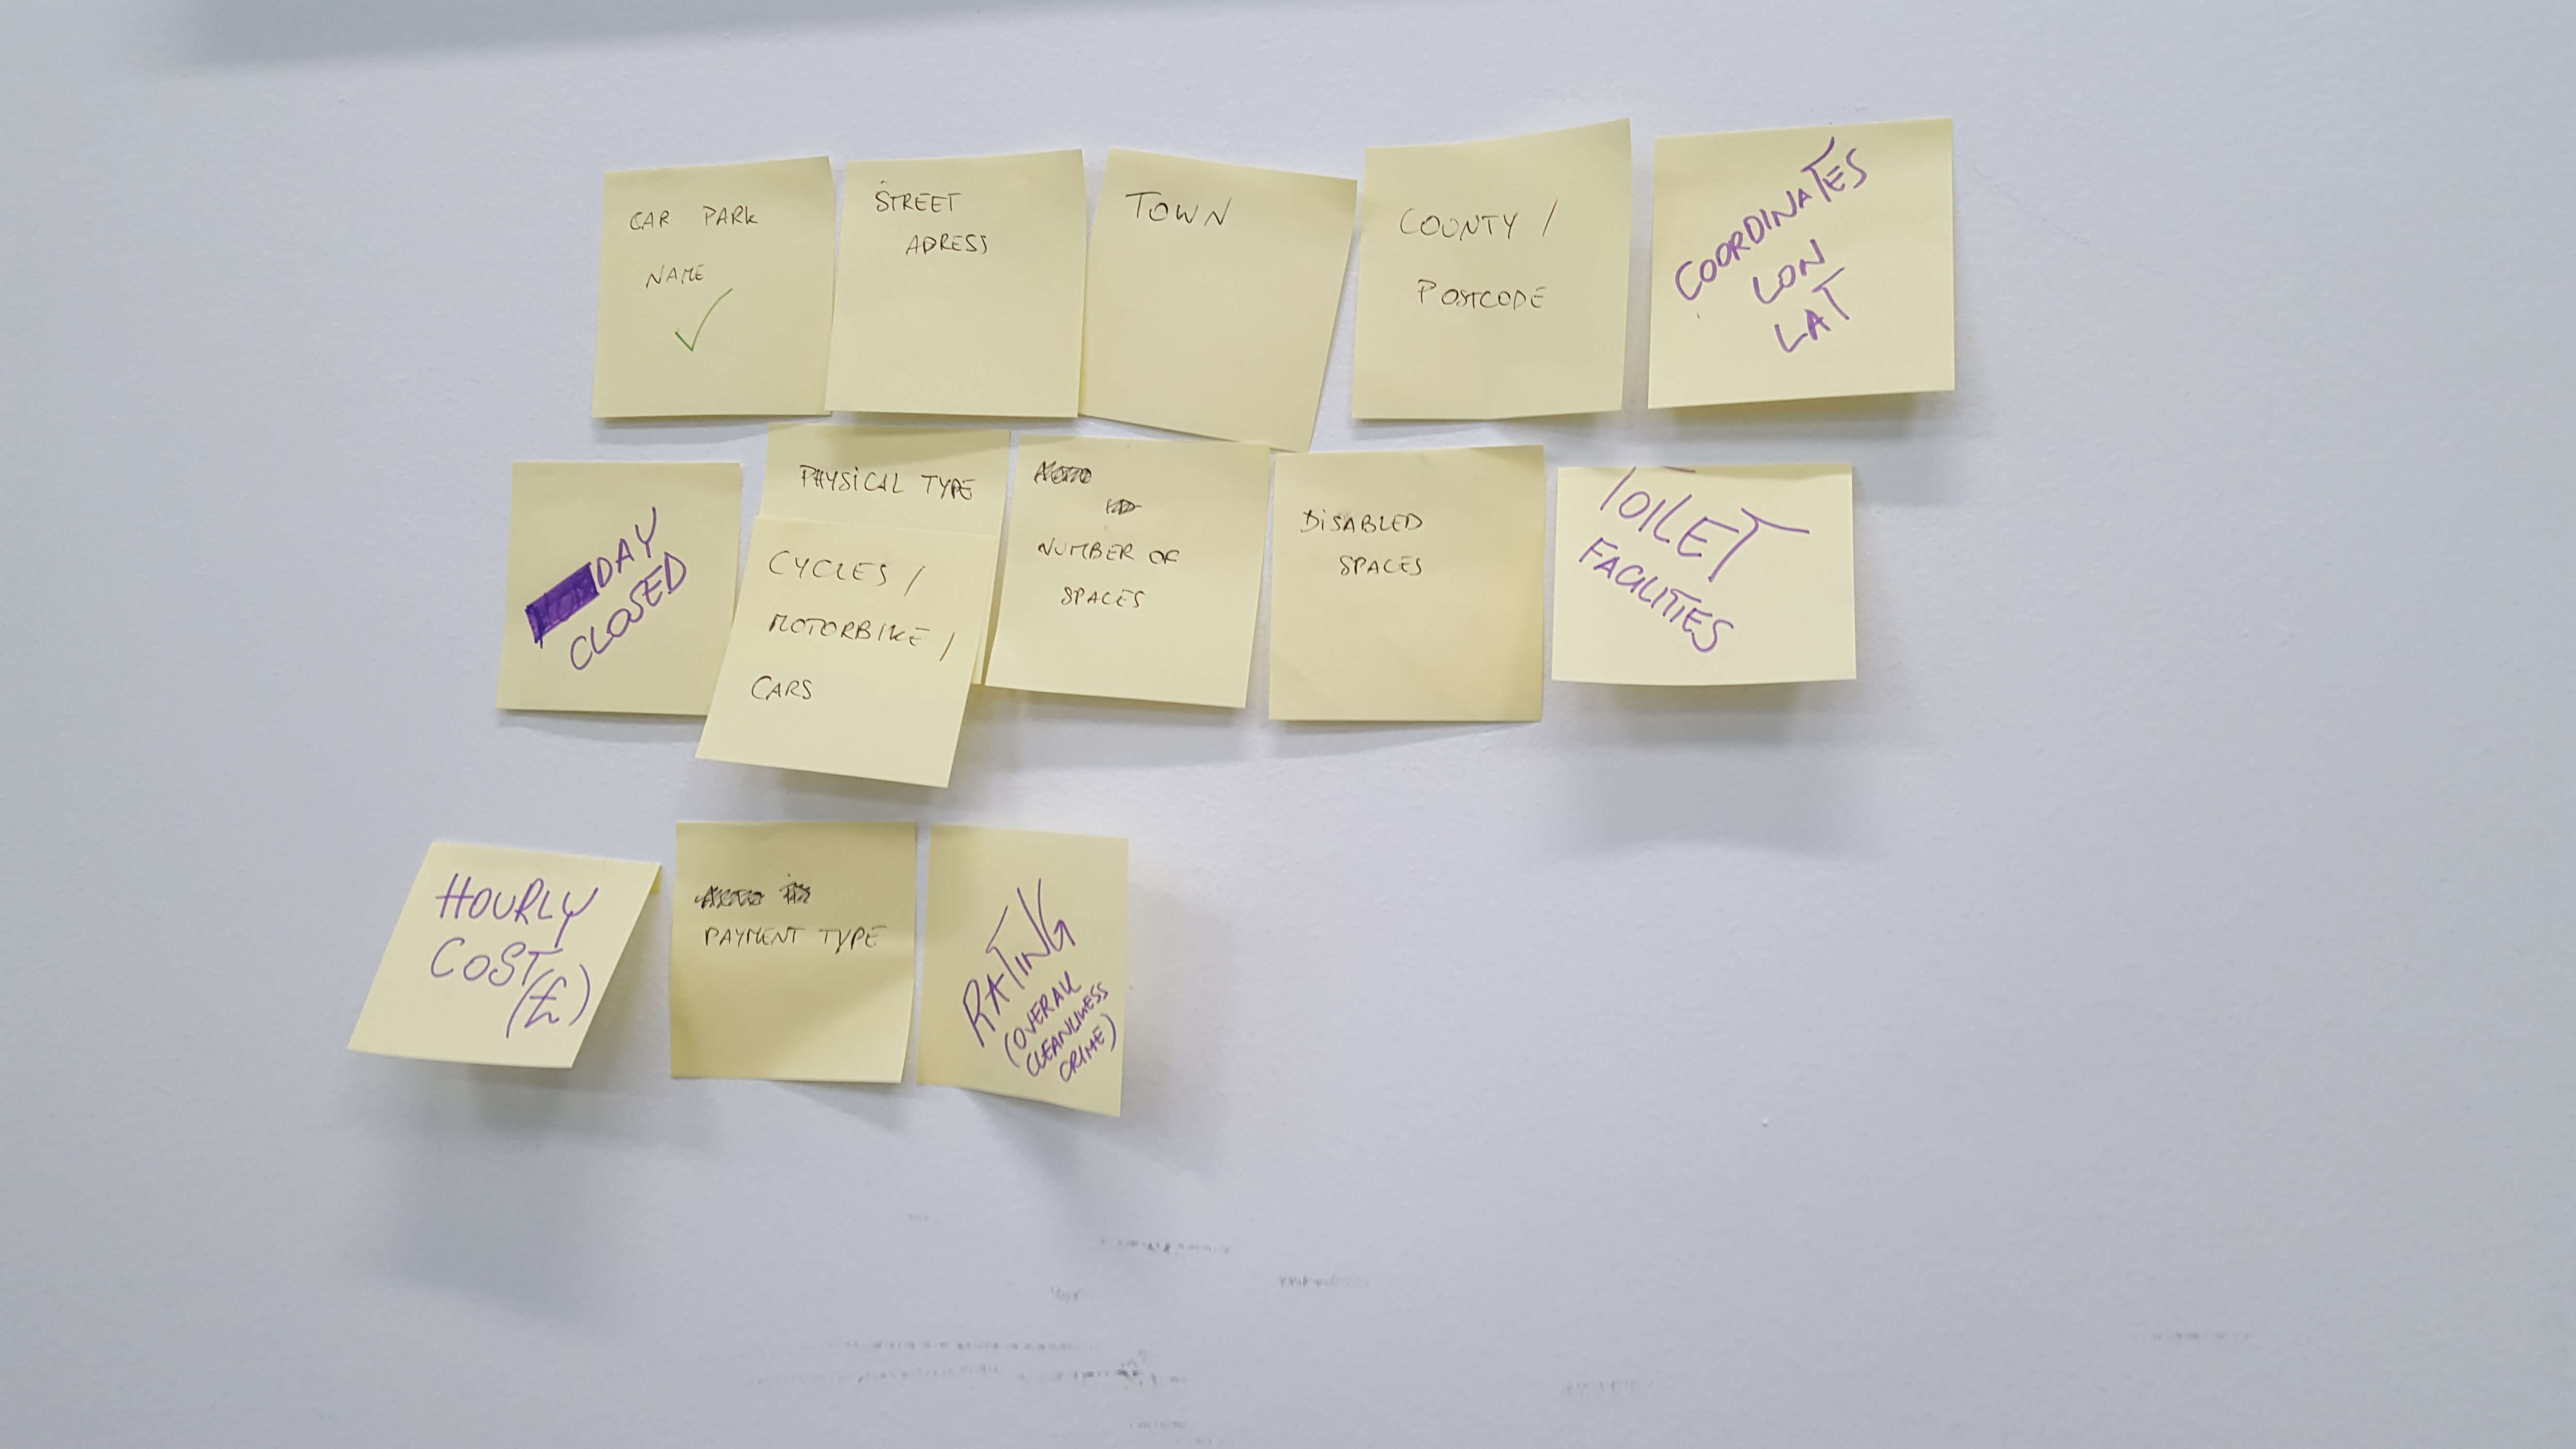
Wonderful day with Caroline who has taught us about infographics and data viz. Great exercises, such as the “selection” of the columns of a dataset putting the fields on post it (see picture below).
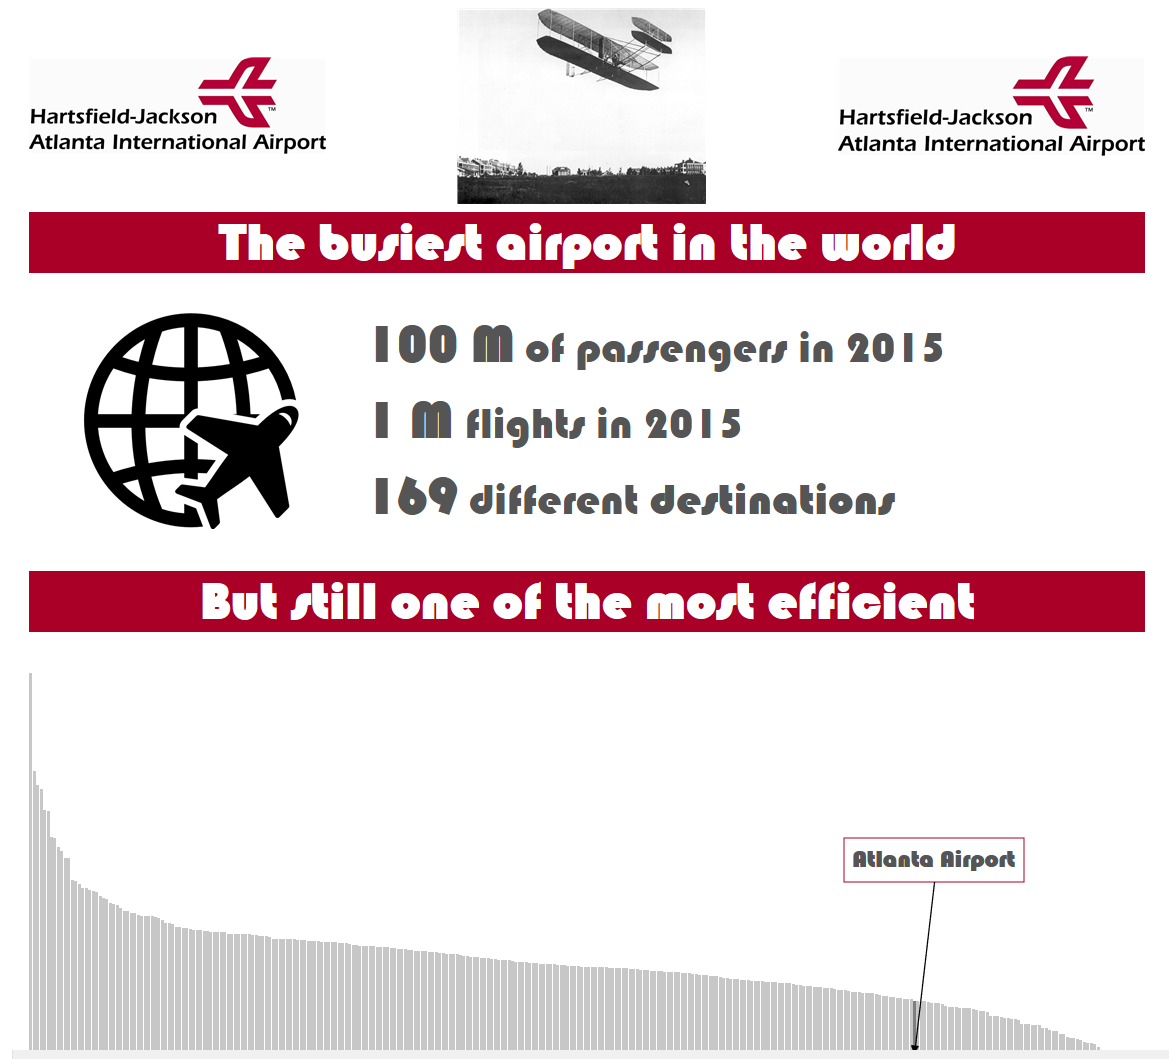
After her class, I decided that my challenge for this week was to create infographics! I decided also my topic: Atlanta airport, the busiest airport of the world! Still, needed to find a story and analysing the data…
But I knew I wanted to build a hub and spoke map with Tableau and with Ben’s help I realized the Alteryx workflow in order to have latitude and longitude of the origin and destination airport in the right shape (and to create the path).
THURSDAY
<<21 hours awake challenge…>> I got up al 3.30 in the morning to catch up an early flight to Milan Mpx. Why? The Tableau experience! 🙂
I had a wonderful day with the italian colleagues, Federica and “the two Davide”. The Information Lab had a stand at this conference at the Radisson Blu hotel in Milan and before and after the conference we have shown some of our dashboard and some tips and tricks about Tableau! It was such a nice day and very good conference and networking.
After a very long day, I spent the 2 hours flight working on my project (first analyzing the data, then drawing and writing it down and finally on Tableau, as Caroline has taught us).
FRIDAY
I felt like I had jet lag in the morning… But better after a while, I could make Andy’s exercises about time. And then trying to solve some issues of my hub and spoke maps and finish the infographics for the presentation.
And here it is, the workflow summary: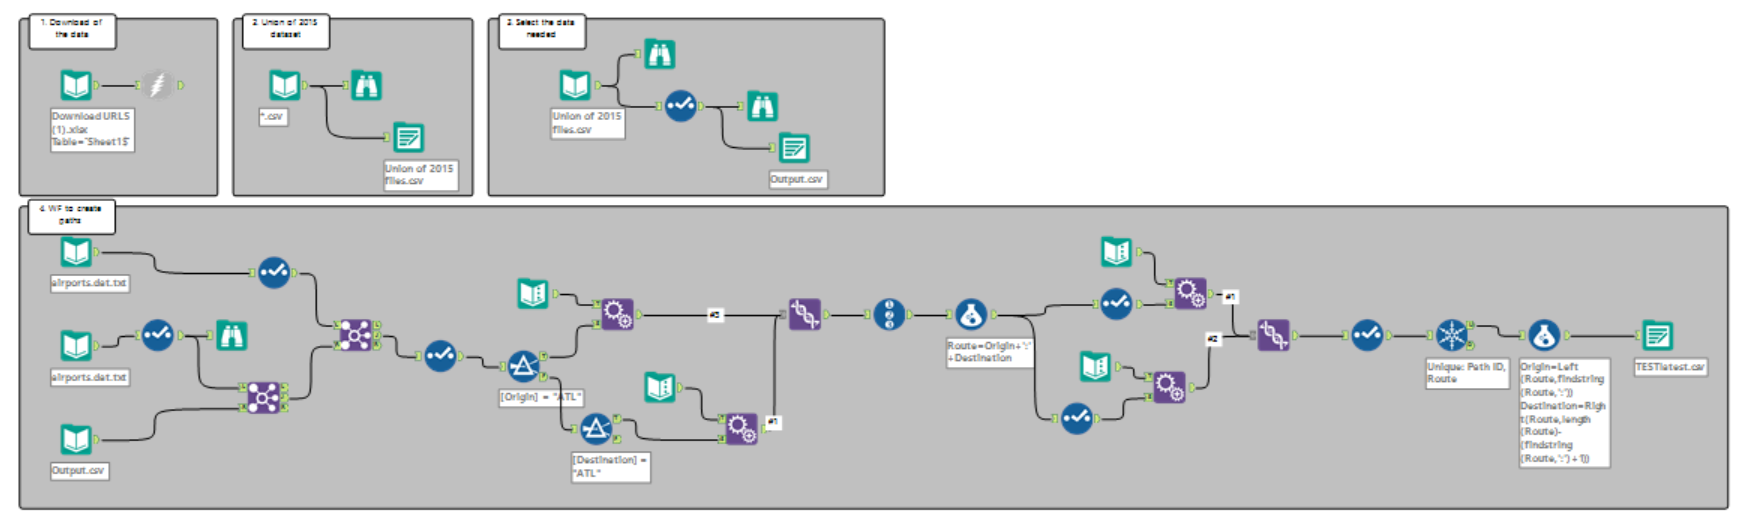
Here the infographic of Atlanta Airport:
Hope you enjoyed!
A presto