


The Data
For today's challenge, we were tasked to use the website cheese.com.
I began working with the data by web-scraping chesses from Mexico, Canada, and the US.
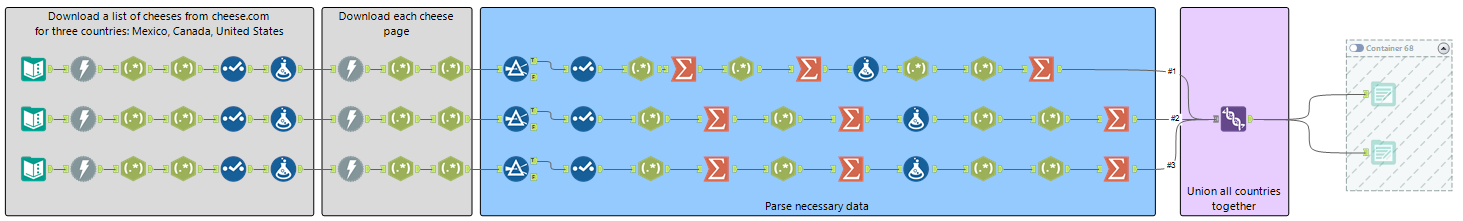
Which ended up looking like this.
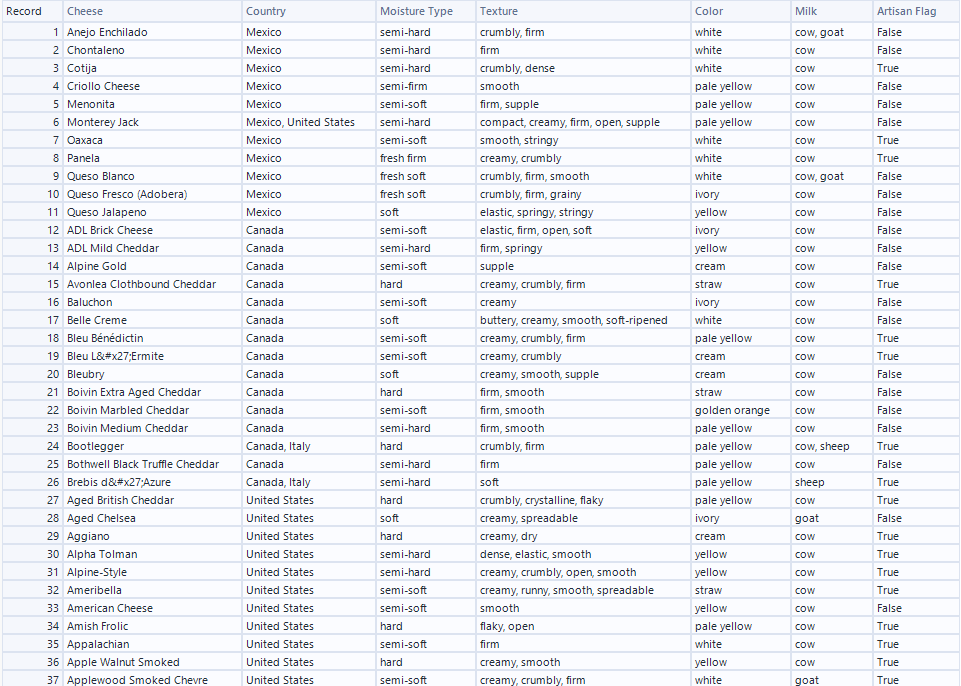
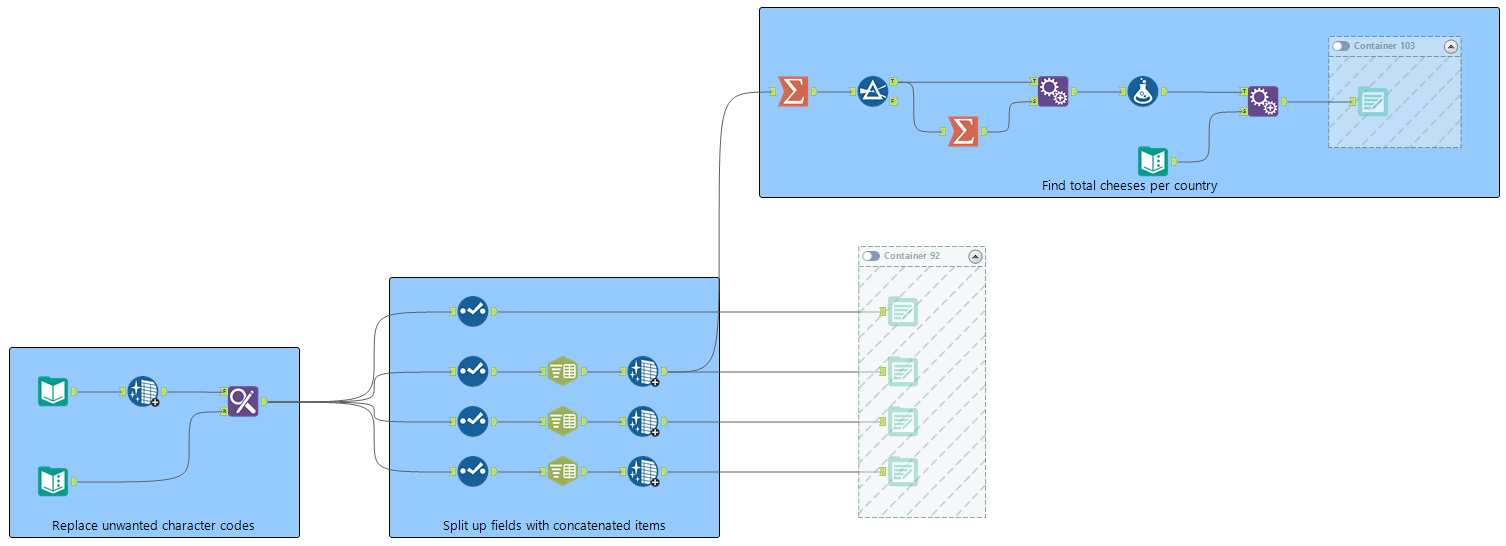
I then went back in and cleaned up this dataset to build out different tables for the fields that included multiple items.
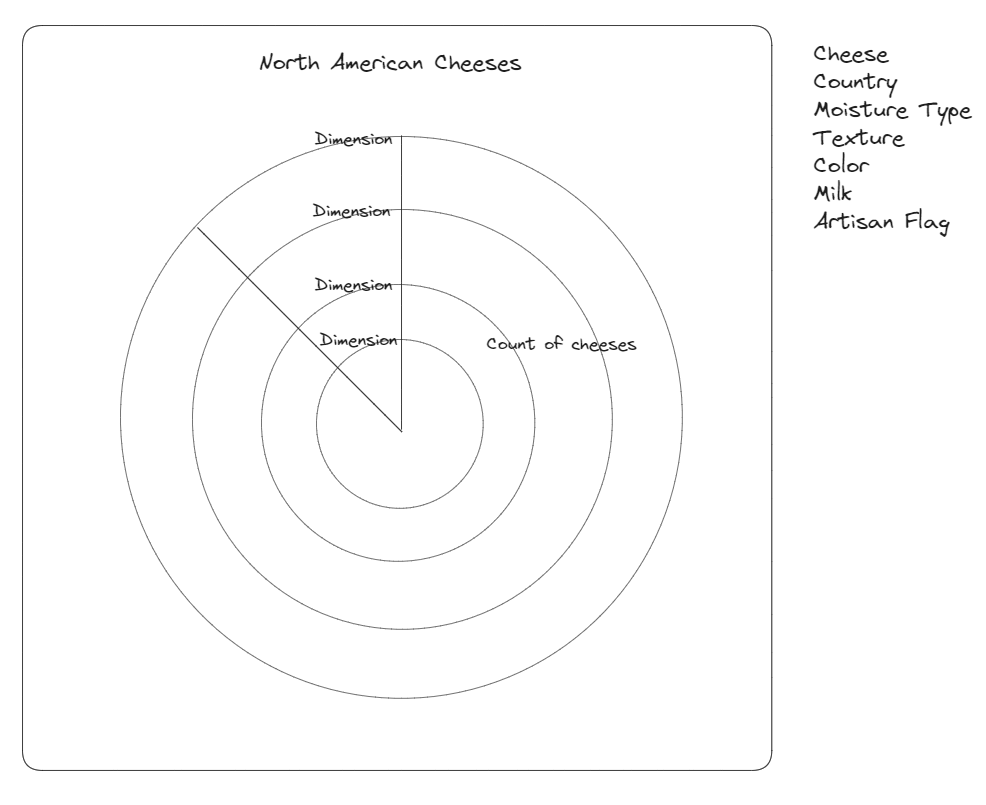
The Plan
After getting the data, I sketched out a rough draft of what I wanted to achieve. I found a blog post made by one of our now US core team member, Jack Parry, to create a radial bar chart. https://www.thedataschool.co.uk/jack-parry/create-a-radial-bar-chart-in-tableau/
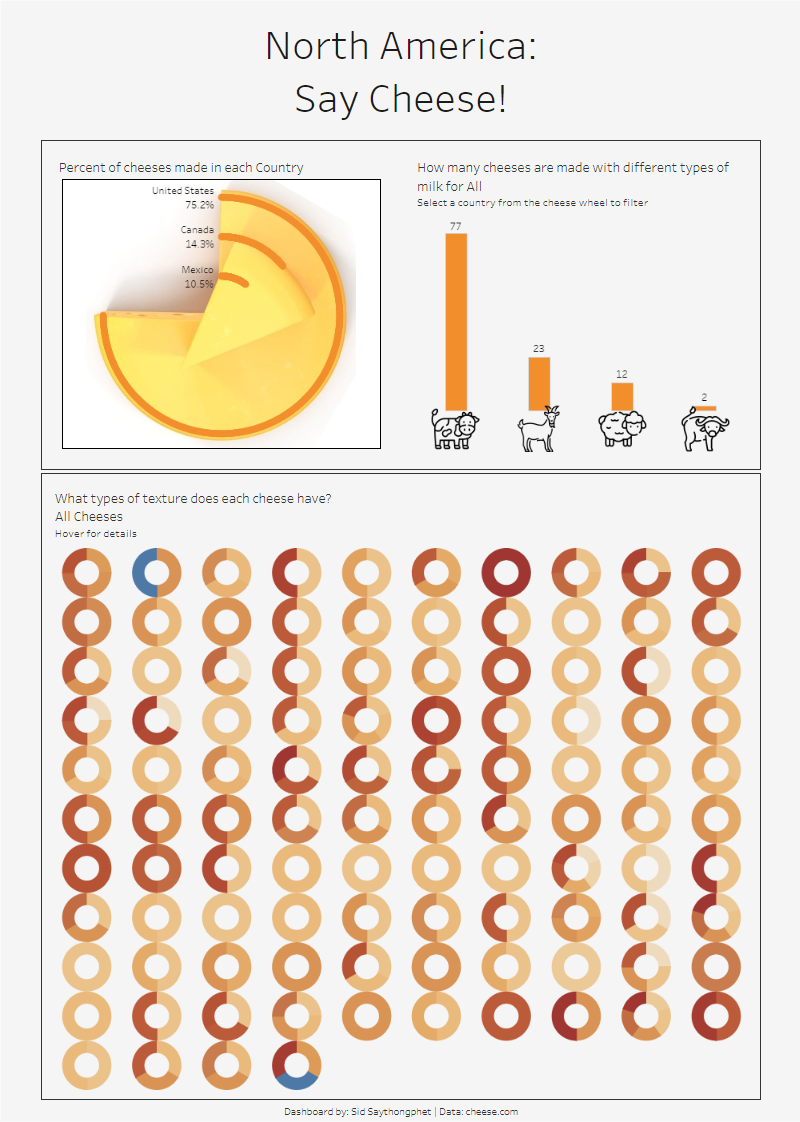
The Result
Conclusion
This challenge brought me back to our week learning how to webscrape in Alteryx. During that week, I got carried away and wanted to make sure i scraped every product possible, which ended up taking a lot of time. This time around, I knew I couldn't do that with the amount of time we had. So I scoped that immediately and just focused on North American countries.