Today was the final day for dashboard week and guess what, we were reunited with Tableau Desktop 😊 Lily and Nick found a data set on Kaggle about the history of power-lifting. The data set provided was already formatted correctly, so there was no need to use Alteryx or Tableau Prep.
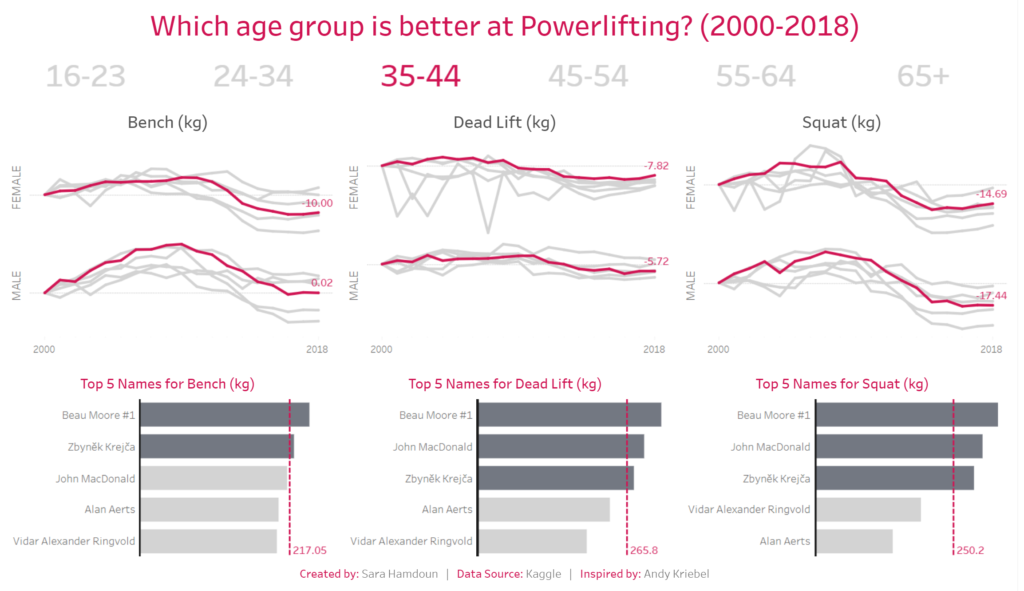
We had 4 hours to understand the data, sketch ideas and create a dashboard which provided key insights. I really enjoyed today, I had the chance to practice with parameter actions and table calculations. I based my dashboard on age groups during 2000 – 2018. Below is my final dashboard:
Although, this whole week has been challenging and tiring, I’ve learnt a tremendous amount. Just to name a few, I learnt how to web-scrape, the differences between Tableau Desktop and Power BI/ Web Edit, as well as learning new tools in Alteryx!