For Day 1 of Dashboard Week we were provided with bodycam data of the New Orleans Police Department since 2014, which included information on the location and date it was recorded and more. I downloaded the data and sent it to everyone as it was a huge file of almost 4 million records, so it took a fair while. Whilst the data itself was interesting, it seemed to me as though it really needed some supplemental data to go alongside it to give some interesting analysis. So what I wanted to do was to find some data showing the actual crime figures within the same region and compare this to the bodycam data. Luckily the NOPD website seems to have a lot of their data on it, so I found the 'Electronic Police Report 2021' (https://data.nola.gov/Public-Safety-and-Preparedness/Electronic-Police-Report-2021/6pqh-bfxa) and downloaded that - there was a 2022 file too however I wanted to ensure I had a full year's worth of data so I went for the year prior.
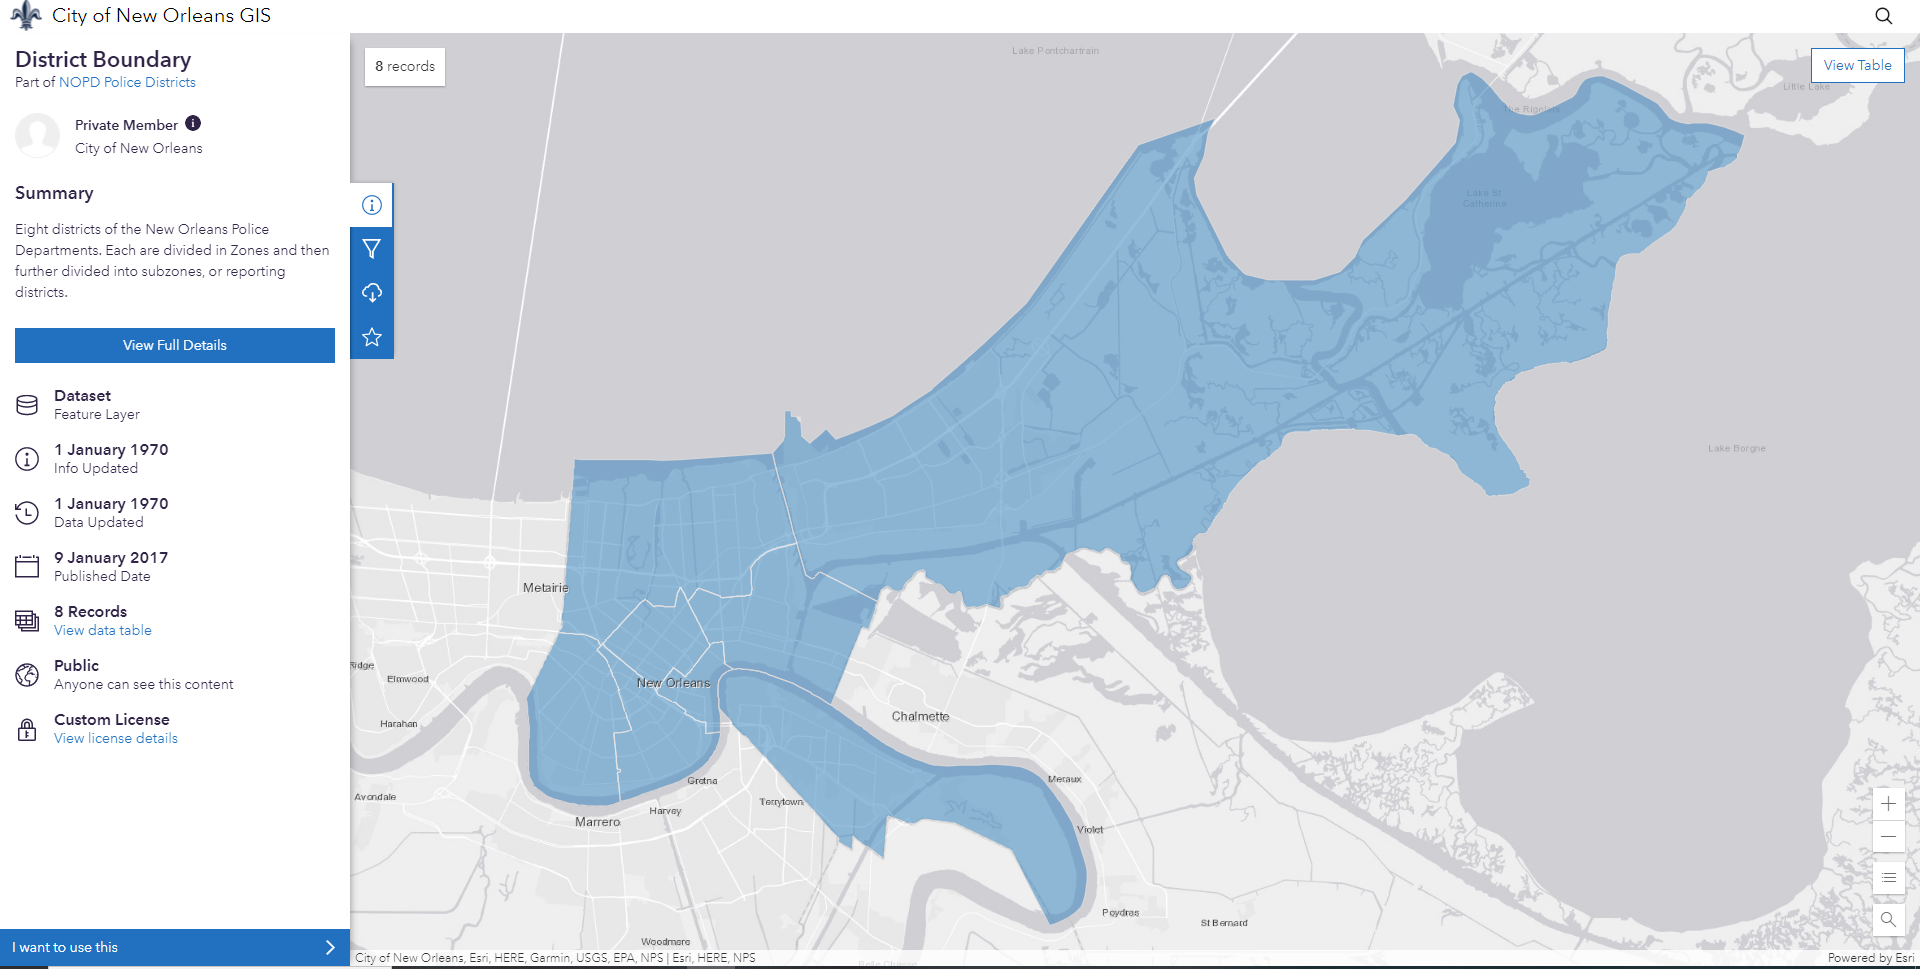
After this, I looked into the data and found that each bodycam recording had a Police District assigned to it. There were 7 districts across New Orleans and I managed to find and download the appropriate spatial file so that I could visualise this well in Tableau - this was found here if anyone is interested in doing something similar: https://portal-nolagis.opendata.arcgis.com/datasets/d9d7c99ddf4645b38d72b09f06dffa66/explore?layer=0&location=30.020465%2C-89.882950%2C11.77. Shortly after this I put together a sketch on a notepad of how I was envisaging my dashboard to be (which ended up being fairly similar to my final product...)
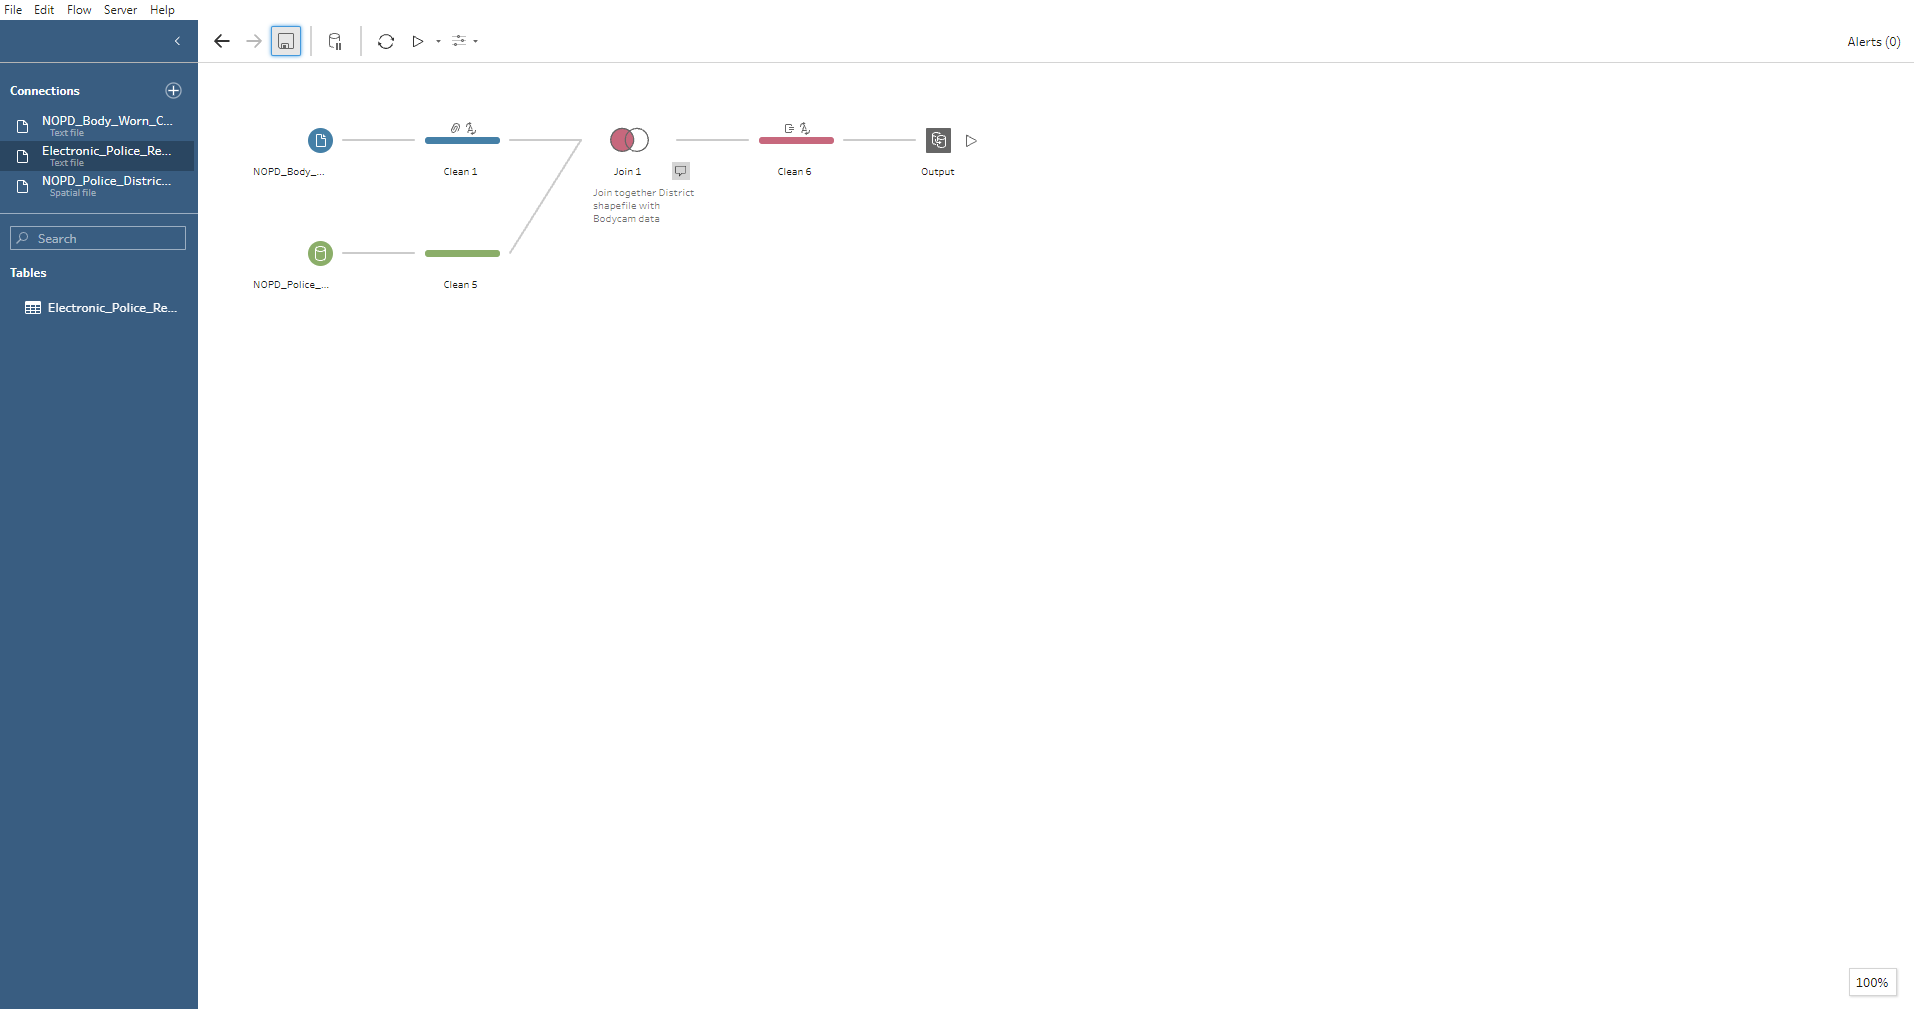
The next step was to start preparing the data. Fortunately the data was already really tidy, so apart from changing a few data types, all that was left to do was to join the spatial file - done with a left join as there were some fields in the bodycam data which were null but I didn't want to exclude these completely. This could have been done in Tableau however I wanted to do it at this early stage so that there would be less to process and I could simply output the file with each record having spatial data attached to it.
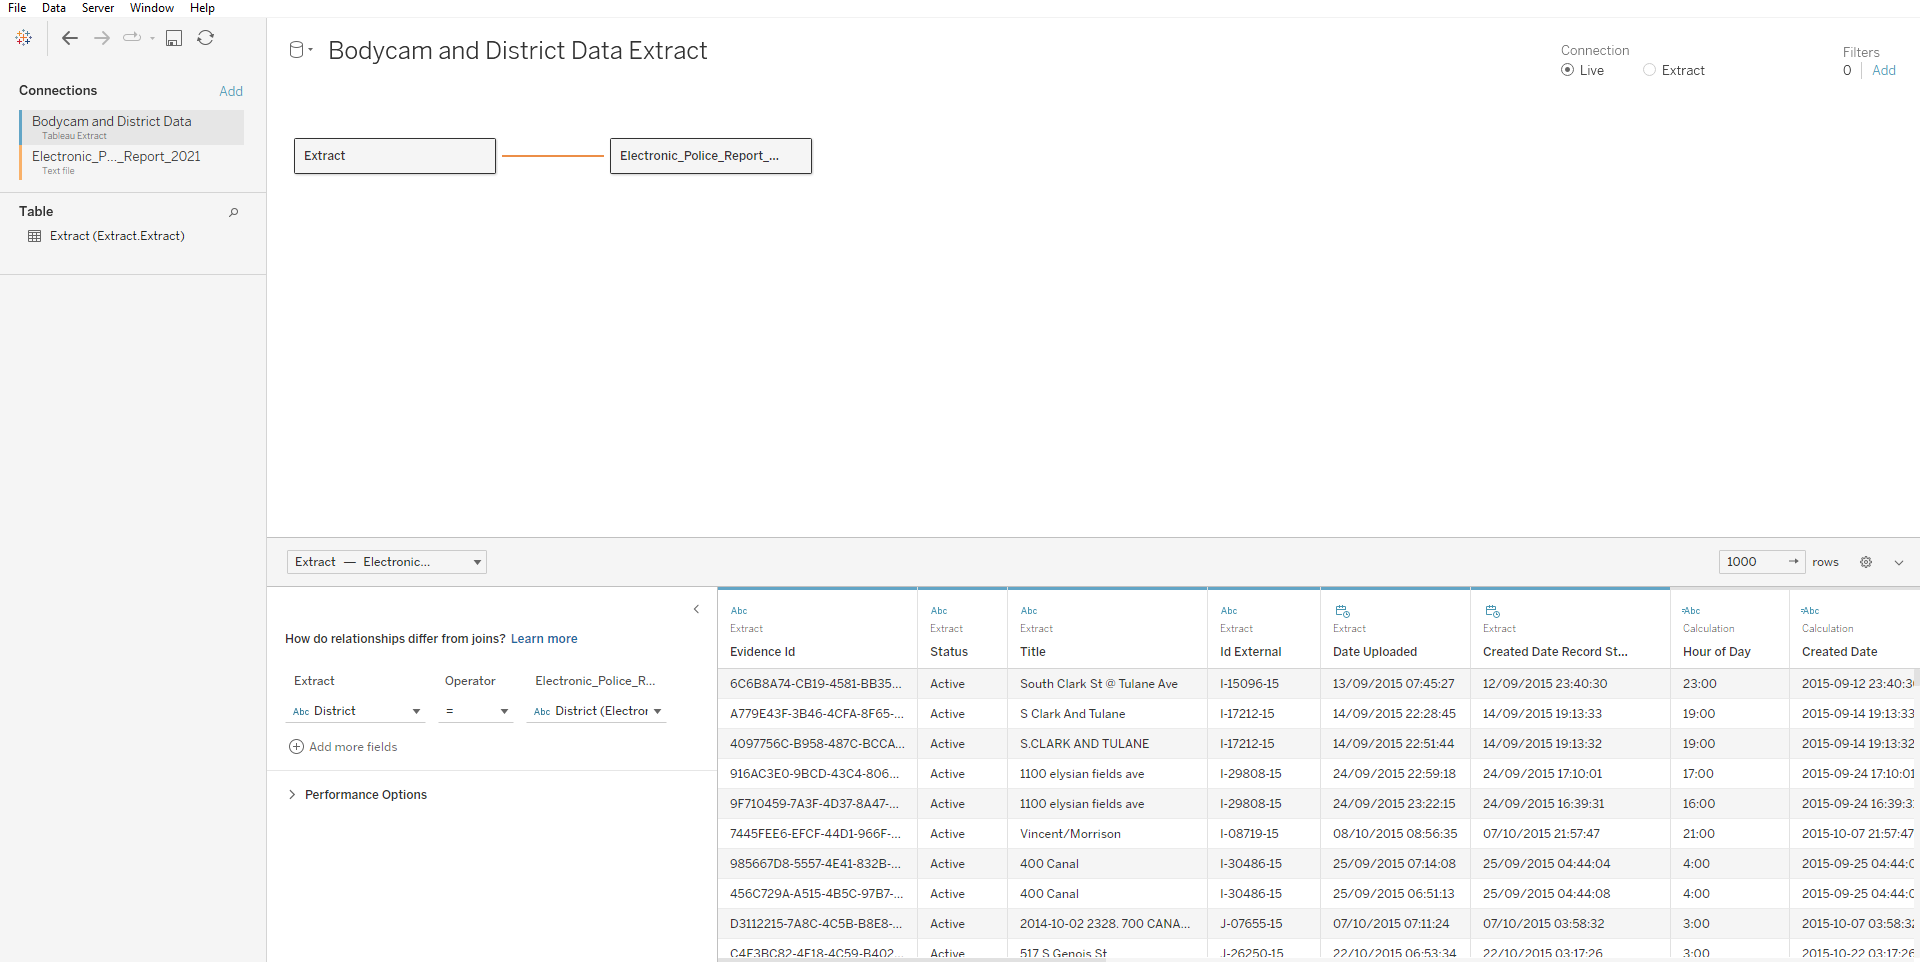
I did instead use a Tableau relationship when bringing in my other police report data for 2021 (as seen below) as this was really easy to do by simply pointing at the 'District' field in each dataset after changing their data type from Number to String.
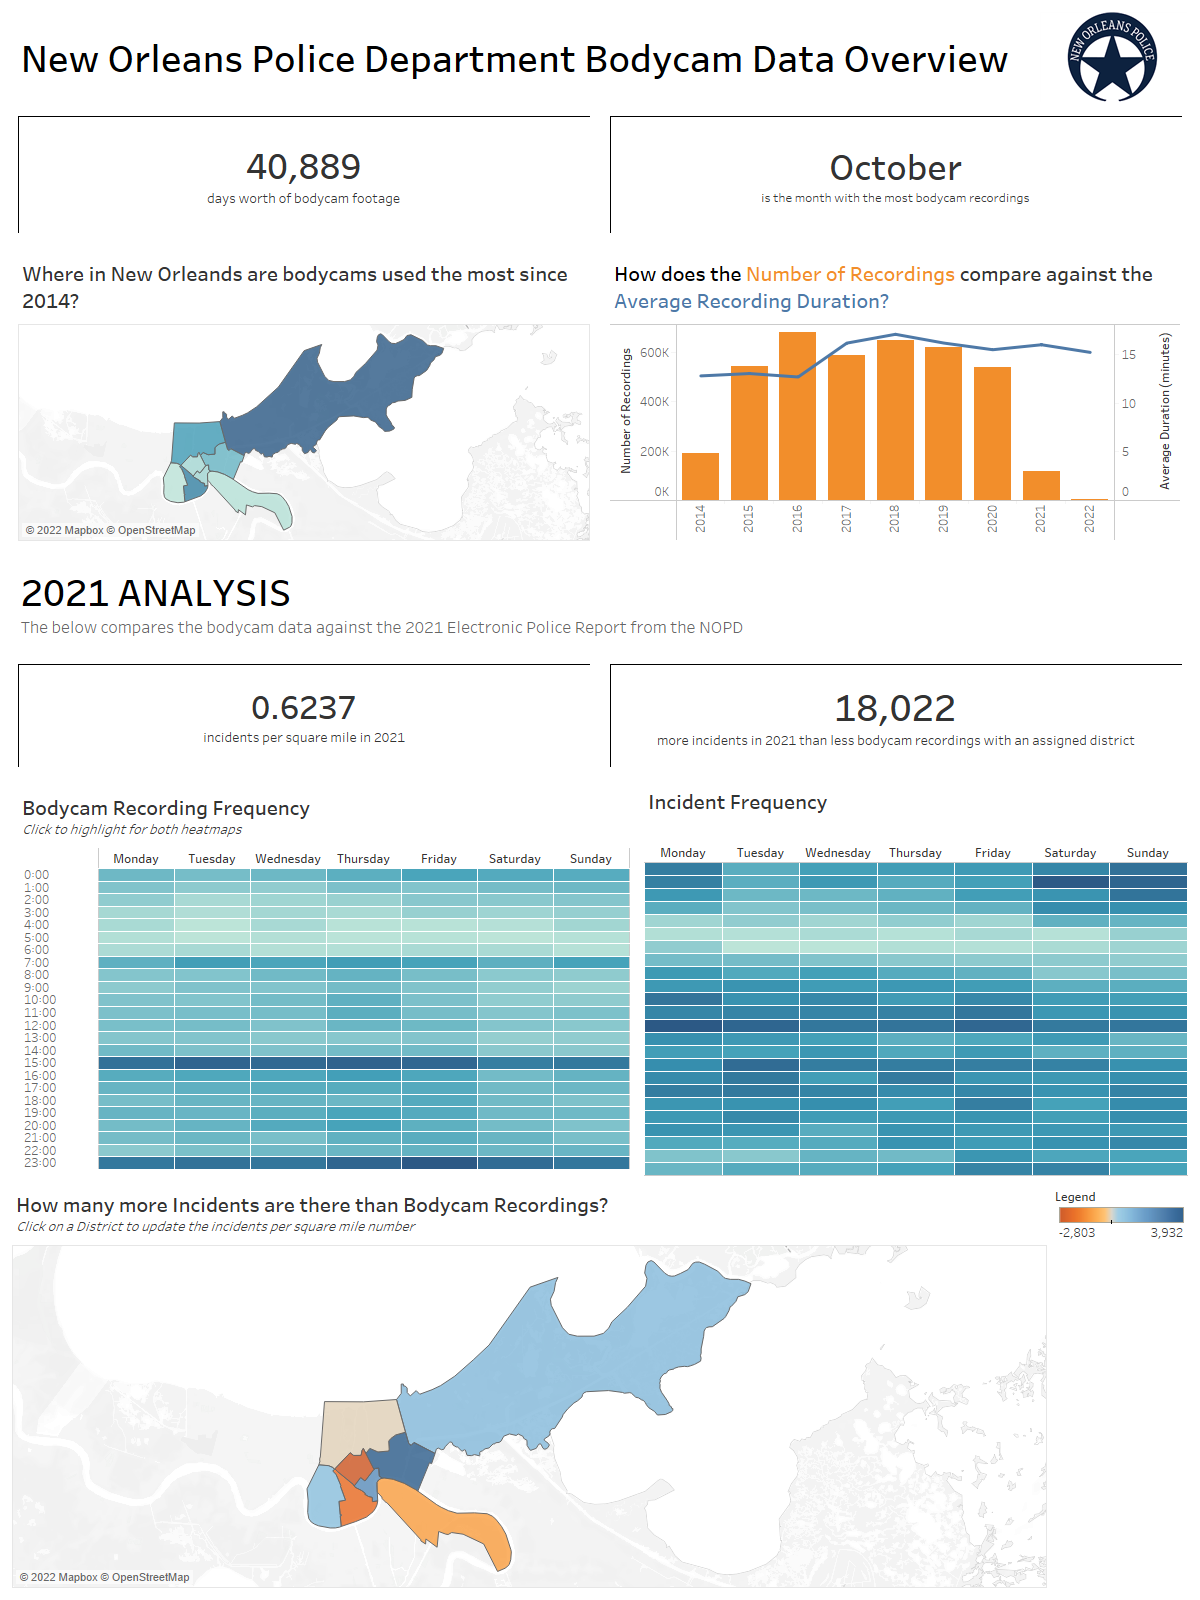
After much playing around with the data and trying new things, I ended up with the below dashboard. My thought process was to have an overview of the bodycam dataset at the top, and then after this do a deep-dive into the 2021 incident data and see how these two compare. Overall it was interesting to see that there are many reported incidents which are still not captured on bodycams and to see which districts have a larger difference between these numbers. This kind of information could be useful for the NOPD to be aware of as it's important to ensure that bodycam footage is captured wherever possible to be used in a court of law and end disputes about an incident that may be ongoing.