For our penultimate day of dashboard week we were provided with an adorable dataset about NYC squirrel sightings. It immediately reminded me of another dataset I had worked with– NYC rate sightings. A questions came to mind:
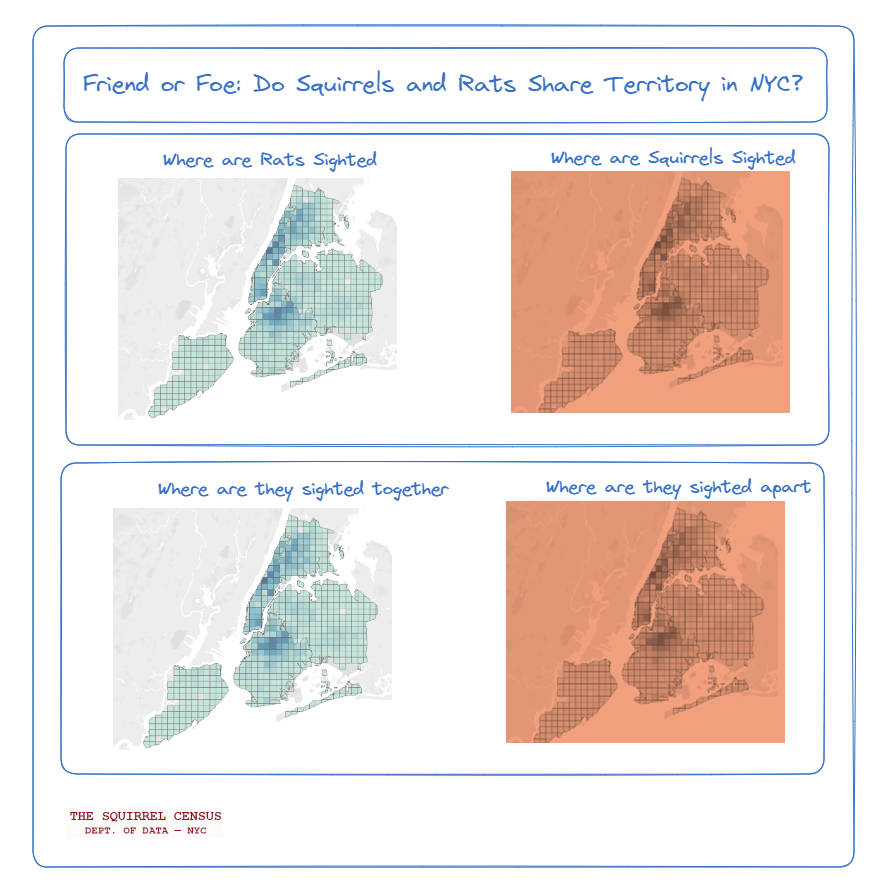
Do the two creatures overlap or keep to separate quarters?
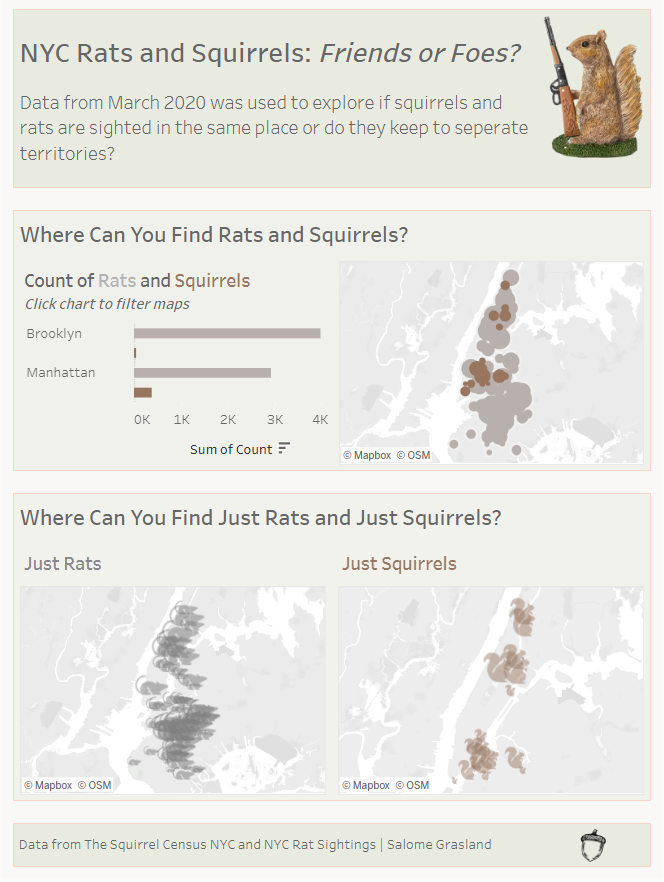
For this dashboard I wanted to visualise where squirrels and rats are most sighted and how much overlap there is between the two.
In Alteryx I used the spatial tools to get centroids of every sighting as well as the spatial match tool to see where rats and squirrels overlapped and where they didn’t. Here is the final dashboard: