Last week during our DS training our we took a deep dive into all things parameter and set actions; some relatively new features in Tableau which allow user to interact with Tableau dashboard in some pretty exciting ways. My post today is going to focus on a particular use case for Set Actions; clicking on a mark in a chart to drill down to the next level of detail, and while this is possible for any kind of chart, the sample that I’ll be focusing on a specific use case, which will be using this filter to go from the year level to the month level in a line chart.
What is a set/ set action
Before starting with the guide it’s worthwhile providing a little bit of context about what sets and set actions are. A set is very similar to a group in Tableau, in that it allows user to specify a subset of data based on a given criteria. A more in-depth explanation can be found on the Tableau site here: https://help.tableau.com/current/pro/desktop/en-us/sortgroup_sets_create.htm
At a basic level a set action is an interactive action on a worksheet or dashboard that is made possible by using a set. When a given mark is selected the values within the relevant set will change and as a result and will then update the visual being displayed. Once again, more information on this topic can be found here: https://help.tableau.com/current/pro/desktop/en-us/actions_sets.htm
Drilling down
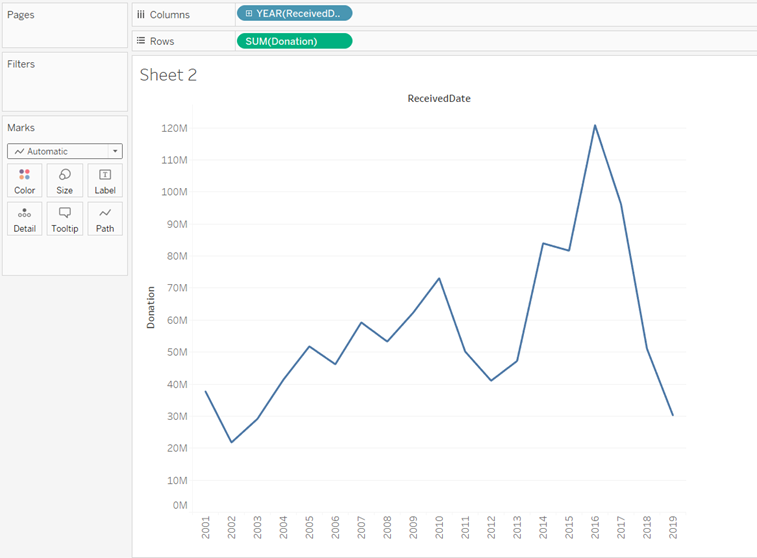
As mentioned above the purpose of this post is to show how to create line chart drill down using set actions, so the first step is to create a line chart using an appropriate data source. I am using data on donations to political parties which can be found here: https://data.world/makeovermonday/2019w41
But any data with a date field and relevant measure to calculate will be suitable.
Create a basic line chart
To create a simple line chart, drag the date field onto the column shelf and the value to me measured onto the row shelf. If the chart type does not default to a line automatically then select the line chart option from the marks dropdown.
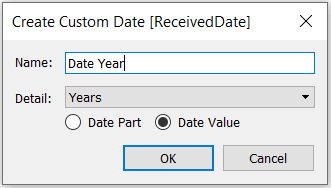
Create custom date field.
This custom date field will be the basis for the set and will be what ultimately drives the set action. The custom date field should truncate the date field to the level that you intend to drill down from. In my example I will be drilling from year to month, so the custom date created will truncate to year. To create the custom date field the steps are as follows.
Right click on the date field > Create > Custom date
- Under detail select years and check the option for date value.
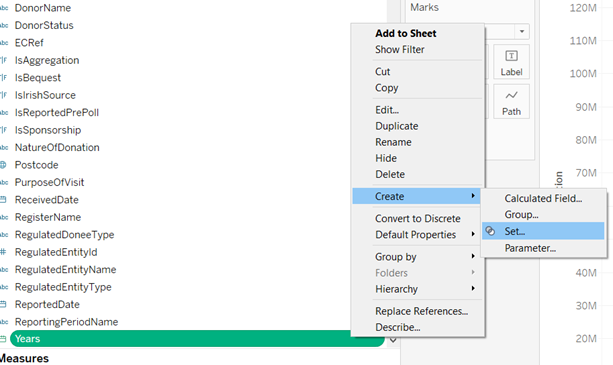
Create the set.
The next step is to create a set based on the custom date that was just made. This set is what will control the drilling down between years and months, as the view will be configured with a set action to show or hide elements based on what is in the set. To create the set, complete the following steps.
Right click on the custom date > Create > Create set.
- In the resulting window give the set an appropriate name.
Create calculated date field based on the set.
This step creates the calculated date field that will placed in the column shelf and will allow the drill down to work. To create the field use the following instructions
Right click the set > Create calculated field
- In the resulting formula window give the field a relevant name, and put in the following code – IF <name of your set> THEN DATETRUNC(<the level you want to drill to in quotes>,<your original date field>) ELSE <your custom date> END
- The image below shows the calculation created for my example.
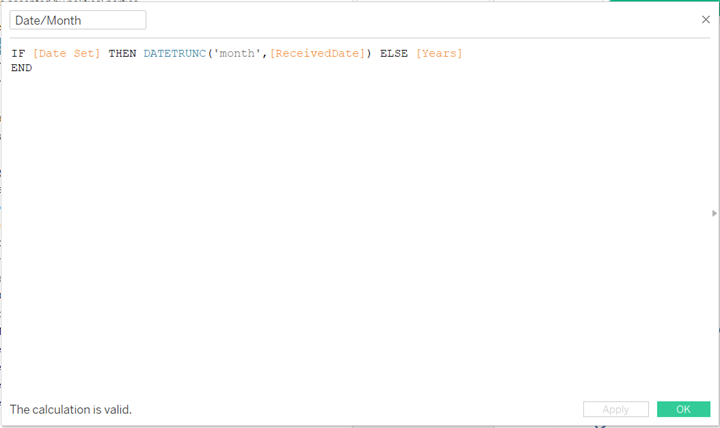
The purpose of this calculation is to check if a data point is in the set, and if it is then return the date truncated to the date specified, otherwise return the custom date. Once the field has been created drag it onto the columns shelf and then do the following.
Right click on the field in the shelf > Exact Date
This ensures that when the drill down happens the correct date will be shown.
Create a set action.
The point of this step is to create the action that will cause the line chart to drill down when clicked. Before this the custom field created must be dragged onto the path icon in the Marks menu, otherwise the set action will show an error. To create the set action complete the following steps.
In the toolbar select worksheets > Actions > Add Action > Change Set Values
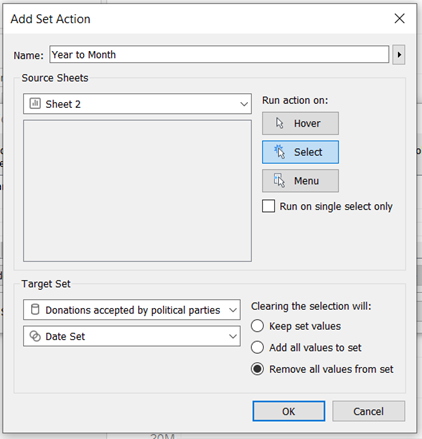
- Give the set action relevant name.
- In the bottom dropdown select the set that will drive the set action.
- Check the radio button to remove all values from the set.
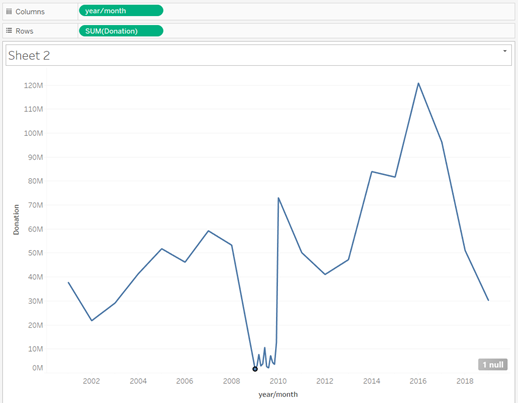
At this point this point the set action will be working, but as shown in the image below, when clicked the line is clicked all other values remain in the view. The following steps will update the view so that only data for the month clicked will be displayed.
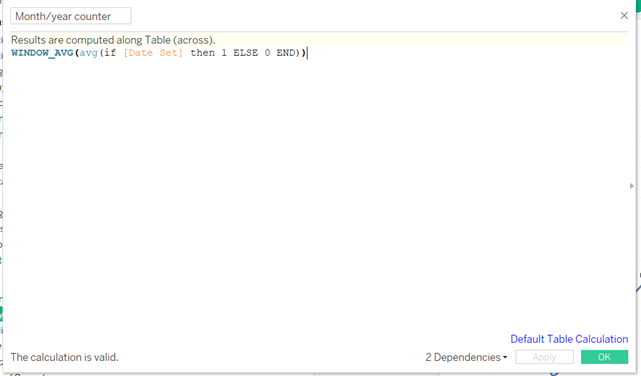
Create a counter
The purpose of this step is to create a counter for the number of months and years in the current view, as it is this count that will be used to filter the date and only show the drilled down values. To do this create a calculated formula with the following expression.
WINDOW_AVG(avg(if <your set> then 1 ELSE 0 END))
Filter based on the counter.
The next step is to add in a filter based on the counter which will remove unwanted value from the view. To do this create another calculated field and put in the following expression.
if <your counter> = 0 THEN TRUE else ATTR(<your set>) END
The purpose of this expression is to only show the original line chart if nothing is clicked, because the counter will return a value of 0. If the line chart is clicked then the set will be returned, only showing the drilled down values.
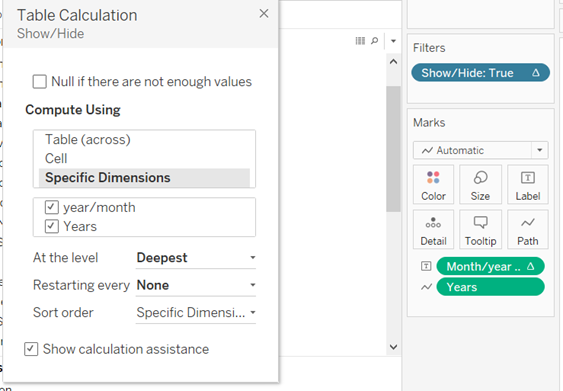
Drag this calculated field to the filter shelf and check true. Right-click the pill in the filter menu and select edit table calculation. Under specific dimensions ensure both options are checked.
Now when clicking on the line chart it should drill down to the months within the year selected and filter everything else from view.
Final Note.
There is a quirk when using this feature to drill down in a line chart whereby if any aggregation apart from sum is applied to the measure then the drill down will not work correctly as seen in the image below.
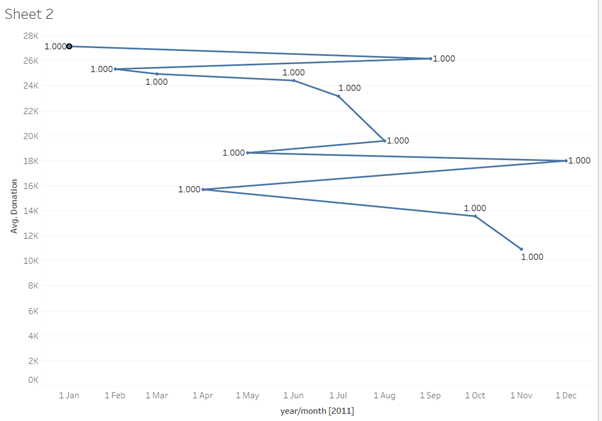
A work around for this as discovered by my colleague @EveThomas1 , is that to have the chart display a different aggregation of the measure apart from SUM, then a separate calculated field must be created with the aggregation applied and then put in the rows shelf. For example, to have this feature work with AVG then a calculated field with the following expression would be needed.
AVG(<your measure>)
And then this field would need to be put on the rows shelf.
This concludes my post on using Set Actions to drill down in a line chart, hopefully it serves as useful guide on how to implement the feature as well as clarifying how it works.