The task for day 3 was to use data from the Harvard Dataverse about access to electricity in India. The data itself was survey responses in .csv format, but the headings were illegible so we had to download the original PDF survey and parse the question titles out using regular expression to then match them up to the fields.
The first step to achieving this using a macro that extracts all of the text from a PDF into a single column, which can then have Regex applied to it to get the data out. My area of focus was going to be on the demographic information provided in the survey responses and then analyse if this has an effect on the access to electricity.
My Workflow.
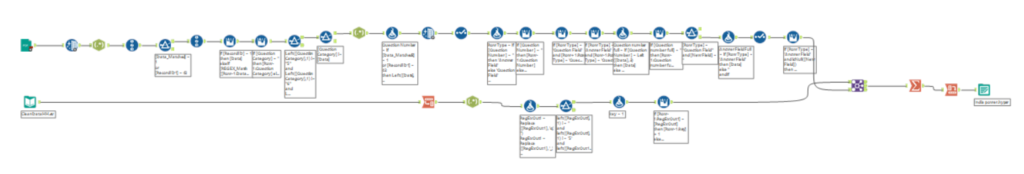
My workflow takes two inputs; the single column of data from the PDF file and csv file containing the data.
I first transposed grouping by location ID the csv to get everything into a single column and then used Regex to get the question number. In cases where a respondent would need to choose from multiple answers, I flagged these and then labelled them with the corresponding question title. I gave answers to questions a number as well to ensure that my join later on would be correct.
The first thing I did the the macro output was use Regex and a filter to remove rows that I din’t need. Then lots of formulas and regex to identify questions and answers.
Then I joined the both flows together, and used a cross tab to put it into a format ready for Tableau.
Dashboard Pending: