Today I encountered some very frustrating issues very early on. The data we were intending to use came in a SAS format which, upon trying to access in alteryx I found to be locked and actually to be in a .sas7bdat format which I could not seem to unlock even after attempting with various softwares that I thought should have done the trick.
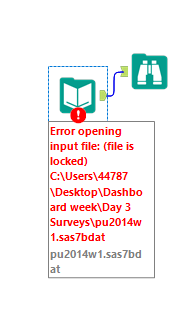
After spending the whole morning attempting to unlock several of these files I decided it was best I try something else in the afternoon. I decided to take the data from some interactive tables on the US Census website, which was easily manipulated and had convenient export functions. This at least allowed me to get my hands on some data.
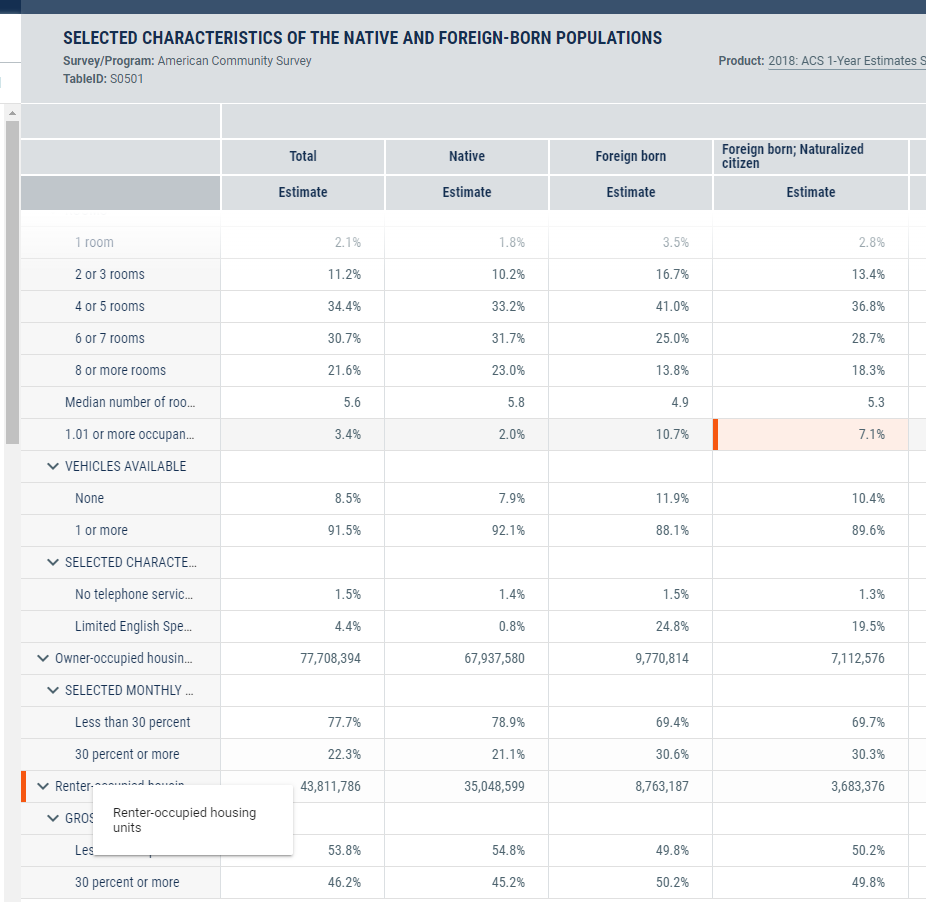
This did, however, result in me changing focus from my original aim of charting food security in the US. I now decided to investigate citizenship, and whether it had any noticeable impact on the lives of those immigrants who attain it. (Hopefully this does not impinge on any of my colleagues topics).
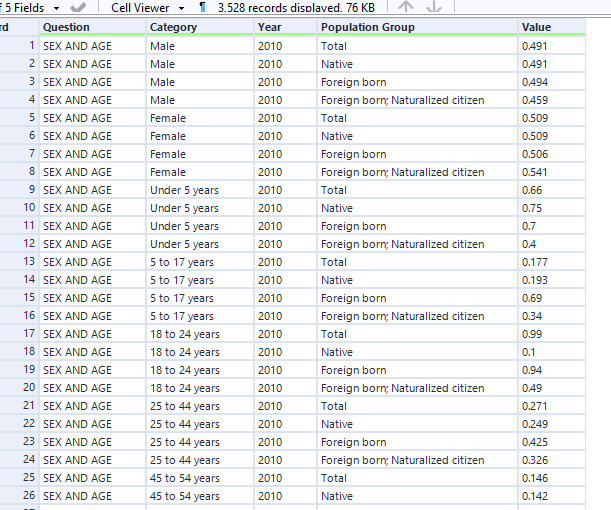
I set about cleaning the data and formatting it in a more convenient way for use in tableau – the typical transpose for any survey data.
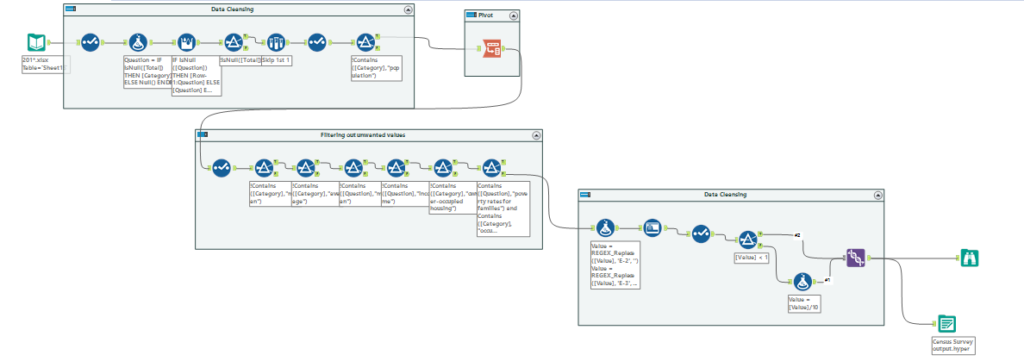
At this point I noticed a couple of issues. With all my data now in one ‘values’ column, some were percentages and some were not, so I filtered out all those that were statistics not percentages. But then I encountered the second larger problem. The data had been inconsistently entered into the table so some values had been written as normal percentages (25%) and some had been written as decimals (0.25). This resulted in many values being orders of magnitude out of kilter with others – very problematic for the visualisation stage.
I attempted to solve this by filtering for numbers greater than 1, and then dividing them to the appropriate level. I then dived into tableau thinking all my problems were solved.
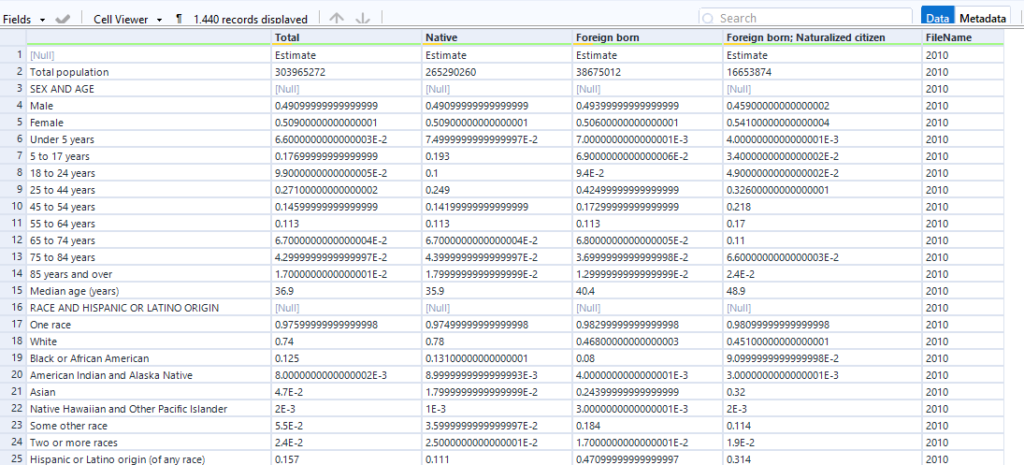
My issues were, however, not solved. Upon getting into tableau it was very clear there were still many erroneous values.

I therefore went back into alteryx to try and solve this a different way. I noticed that where % signs had been, were now values like E-2 and E-3. So I filtered on these and then followed the same steps hoping this time I would get more satisfactory results.
The results of this proved to be better, but still not perfect. But fortunately the occasions where results were wrong were very obvious as values would leap up by an order of magnitude from the previous value. I therefore carried on in tableau being careful to avoid using clearly erroneous data.
I was now tighter for time than I would’ve wanted, but with the data in the right shape it allowed me to make charts with relative ease, and so a dashboard quickly started coming together.
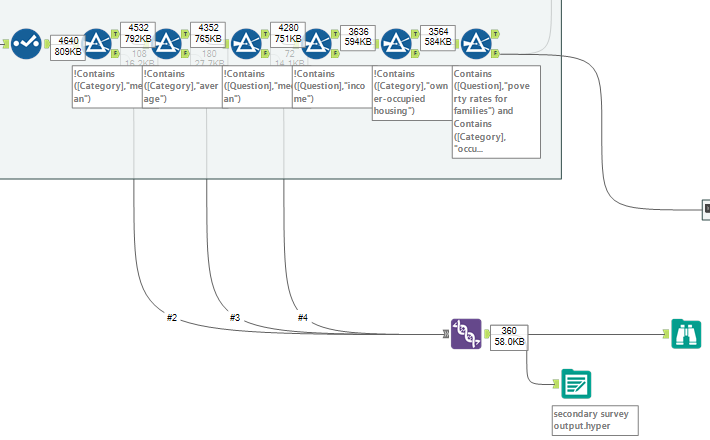
I went back into alteryx to produce a secondary output with the non-percentage values I had discarded earlier. But didn’t have enough time to incorporate the charts I made into my dashboard.
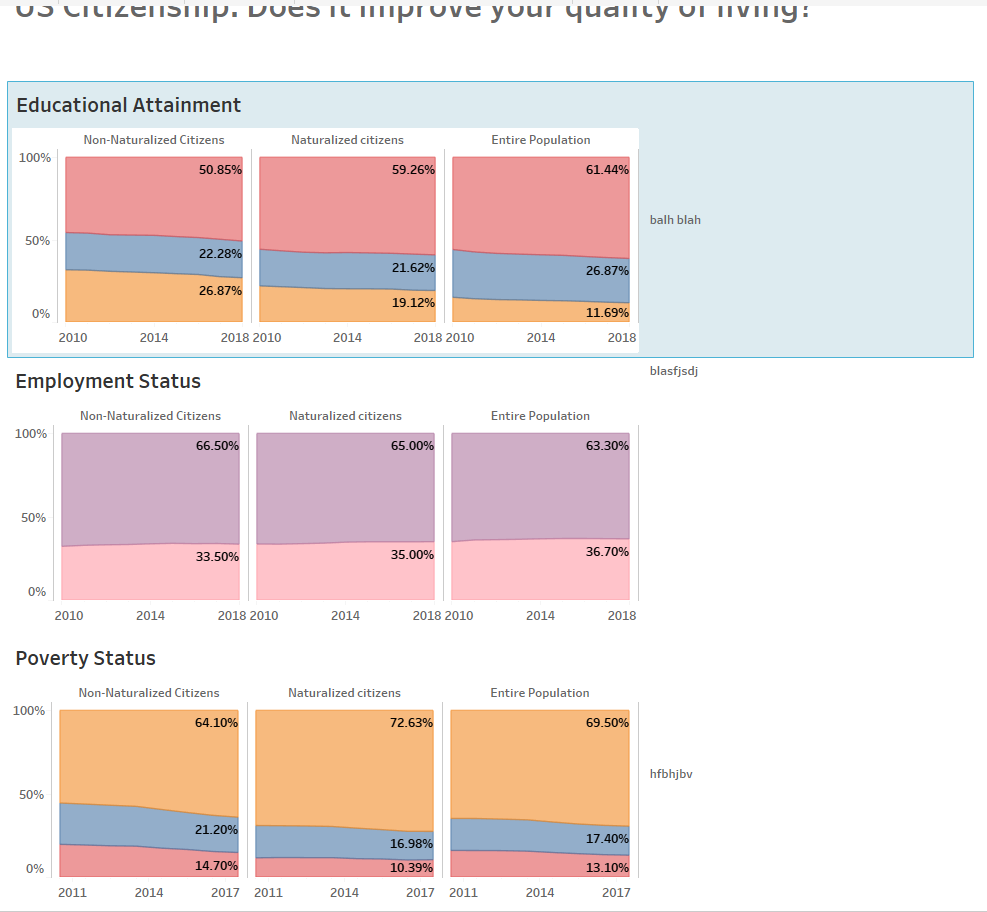
From here I focused on the design of my dashboard, attempting to use a variety of colours to distinguish the different points I wanted to make without the variety of colours becoming overbearing.
And this was the finished result:
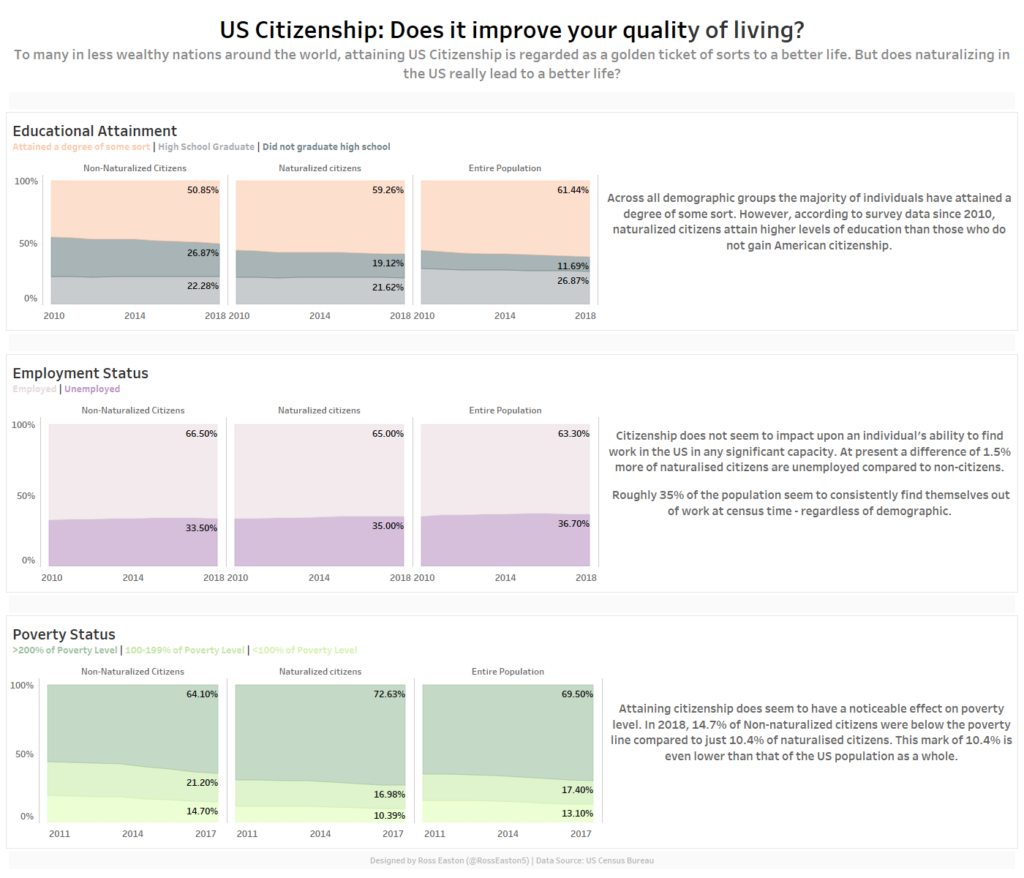
Interactive viz: https://public.tableau.com/profile/ross.easton#!/vizhome/USCitizenshipDoesitimproveyourqualityofliving/Dashboard1?publish=yes