A quick tip on how to create independent colour legends when using multiple measure values in Tableau.
The head coach of upcoming Data School Australia, Craig Dewar (@craigsdewar), is visiting us in the UK. And as expected, we (DS8) are trying to absorb as much information from this Tableau and Alteryx expert.
Throughout a project week, Craig made me aware of a simple, yet, mind blowing feature in Tableau I was not yet aware of! Using separate legends for Measure Values!
1. Use Separate Legends
It is unlikely that all the measures you are using are on the same magnitude and importance when using Measure Values and changing the diverging colours for each Measure Value allows you to focus the attention on one or two measures of choice.
Follow the steps in the GIF below, to blow your own mind!
You can change the colours by double clicking on the colour in the legends.
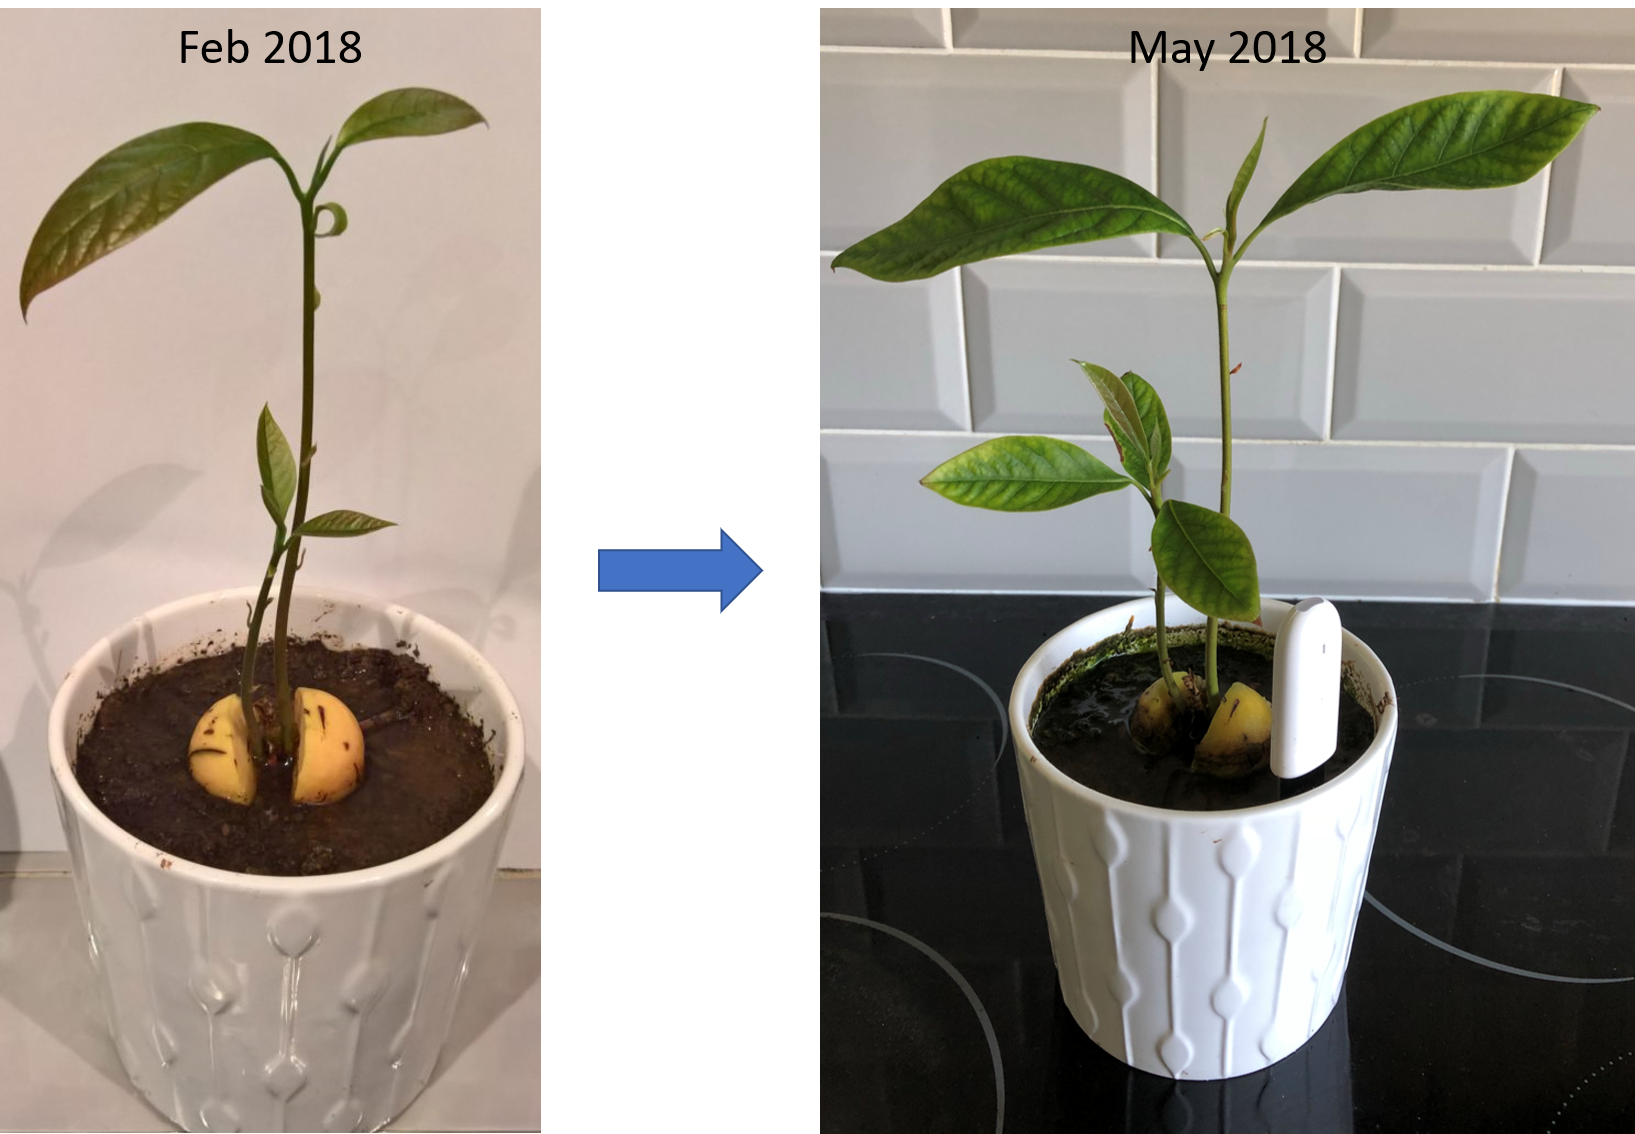
2. The Avocado Tree Project – A Vernooij Special – Part 2
Given this is such a short post, this would be a great time to update you on The Avocado Tree Project – A Vernooij Special.
Part 2: Soil has been replaced and the plant is going strong in this weather!
That’s it for now. Feel free to contact me about any of the content on Linkedin or Twitter @RobbinVernooij