A recap of Dashboard Week Day 5 with tips and tricks used throughout.
Dashboard Week has come to a successful end, with Friday being particularly hectic.
- 9 am: present Thursdays work
- 10 am: start on the new London Air project
- 1:30 pm: should probably move from Alteryx to Tableau…
- 3 pm: presentations in front of a mixture of (potential) new Info Lab clients, Tableau employee’s and previous cohort data schoolers.
Below a recap on each dashboard day, and what tips & tricks I picked up on.
1. Dashboard Week Day 5 – Blended Dual Axis and API’s
The London Air Quality API is a great open source of information of pollution readings in and around London. It does require a bit of reading before you figure out what queries you need to send to the API in order to get the data you want.
For people who haven’t used API’s before to obtain data, in basic words: it is a web server, like a website, that you can send a request for data using their protocols.
For instance if I put the following URL address in a browser
” http://api.erg.kcl.ac.uk/AirQuality/Daily/MonitoringIndex/GroupName=London/Date=2018-01-01/Json ”
the London Air API will return me the air quality data, on a daily basis, for the monitoring index, in London, on 2018-01-01 in Json format.
All the orange coloured text in the URL can be replaced with things such as, hourly, a London borough name, a different date, etc. You can then use software to cycle through these request, such as Alteryx or R, to accumulate all the data you want. However, each API is different and you have to read up on their documentation on the website, test a few requests, to see what you need.
Given the time restrictions of the day, I ended up focusing only on pollution readings near the The Data School, to get an idea on how bad it actually is!
After obtaining this data and cleaning it in Alteryx, I had a quick look in Tableau. I then further narrowed it down the pollutants to just nitrogen oxides (causing smog and acidic rain) to simplify the viz.
The data I obtained was just for 2018 till the current Friday, but I had it on a 15 minute basis, given me a lot of granularity to play with!
The end result consisted of combining previous WorkoutWednesday tips with the new step and bump charts in Tableau 2018.1, with the average line being filtered by the heatmap when you click on it!
Conclusion: either get into work before 5 am or pretend I don’t know about it…
2. Dashboard Week Day 4 – Dashboard Week in Practice
Having a shadow day (following fellow data schoolers at clients) made me realise how fast turnaround projects, such as the Dashboard Week, prepare you for the real world.
I mocked up some quick tips on how to schedule such a day in one of my previous blogs: check it out!
3. Dashboard Week Day 3 – Assigning multiple images as custom shapes in Tableau and API image extraction
The most exciting Dashboard Week Day in my opinion, as the API is brilliantly setup and the topic was something I can relate to. Check out my two tips on extracting image files from API’s using Alteryx and how to automtically assign multiple images as custom shapes in Tableau: Get Schwifty!
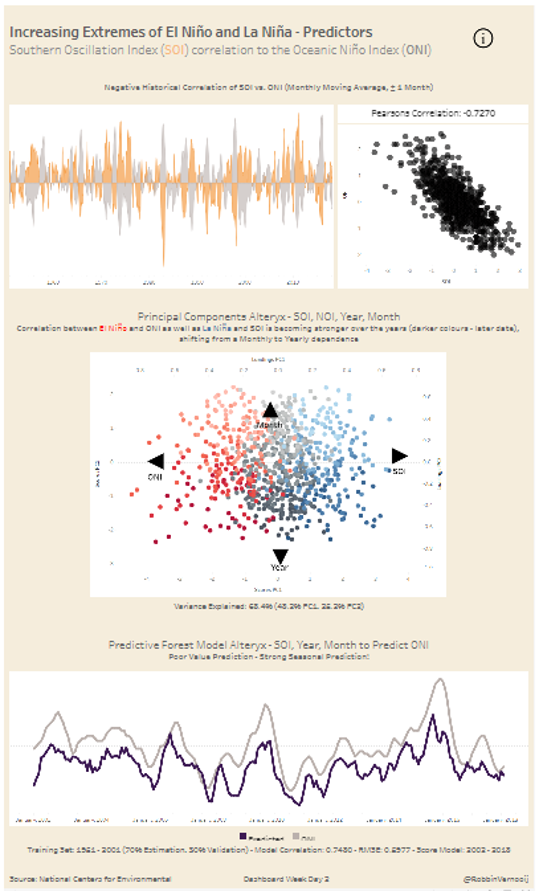
4. Dashboard Week Day 2 – New to predictive workflows? Check this out!
Apart from obtaining the data, Andy challenged us to predict the natural phenomena: El Niño and La Niña. When you start doing predictive analysis, it becomes critical that you start with the basics, i.e., look at easy charts first to see where you want to go before even starting predictive! It is easy to get lost in the statistics, check out my approach of the day and how it led to pretty amazing results within just 2 hours!
5. Dashboard Week Day 1 – How to utilise Pages and change the order of animation in Tableau.
A funny day with a last minute data change, nevertheless, perfect data set for me to practice the Pages shelf in Tableau. Check out my blog on how to utilise Pages and change the order of animation in Tableau.
That’s it for now. Feel free to contact me about any of the content on Linkedin or Twitter @RobbinVernooij