Maps are a powerful tool in data visualisation but it is important to pay attention to the details when choose to use them in your work
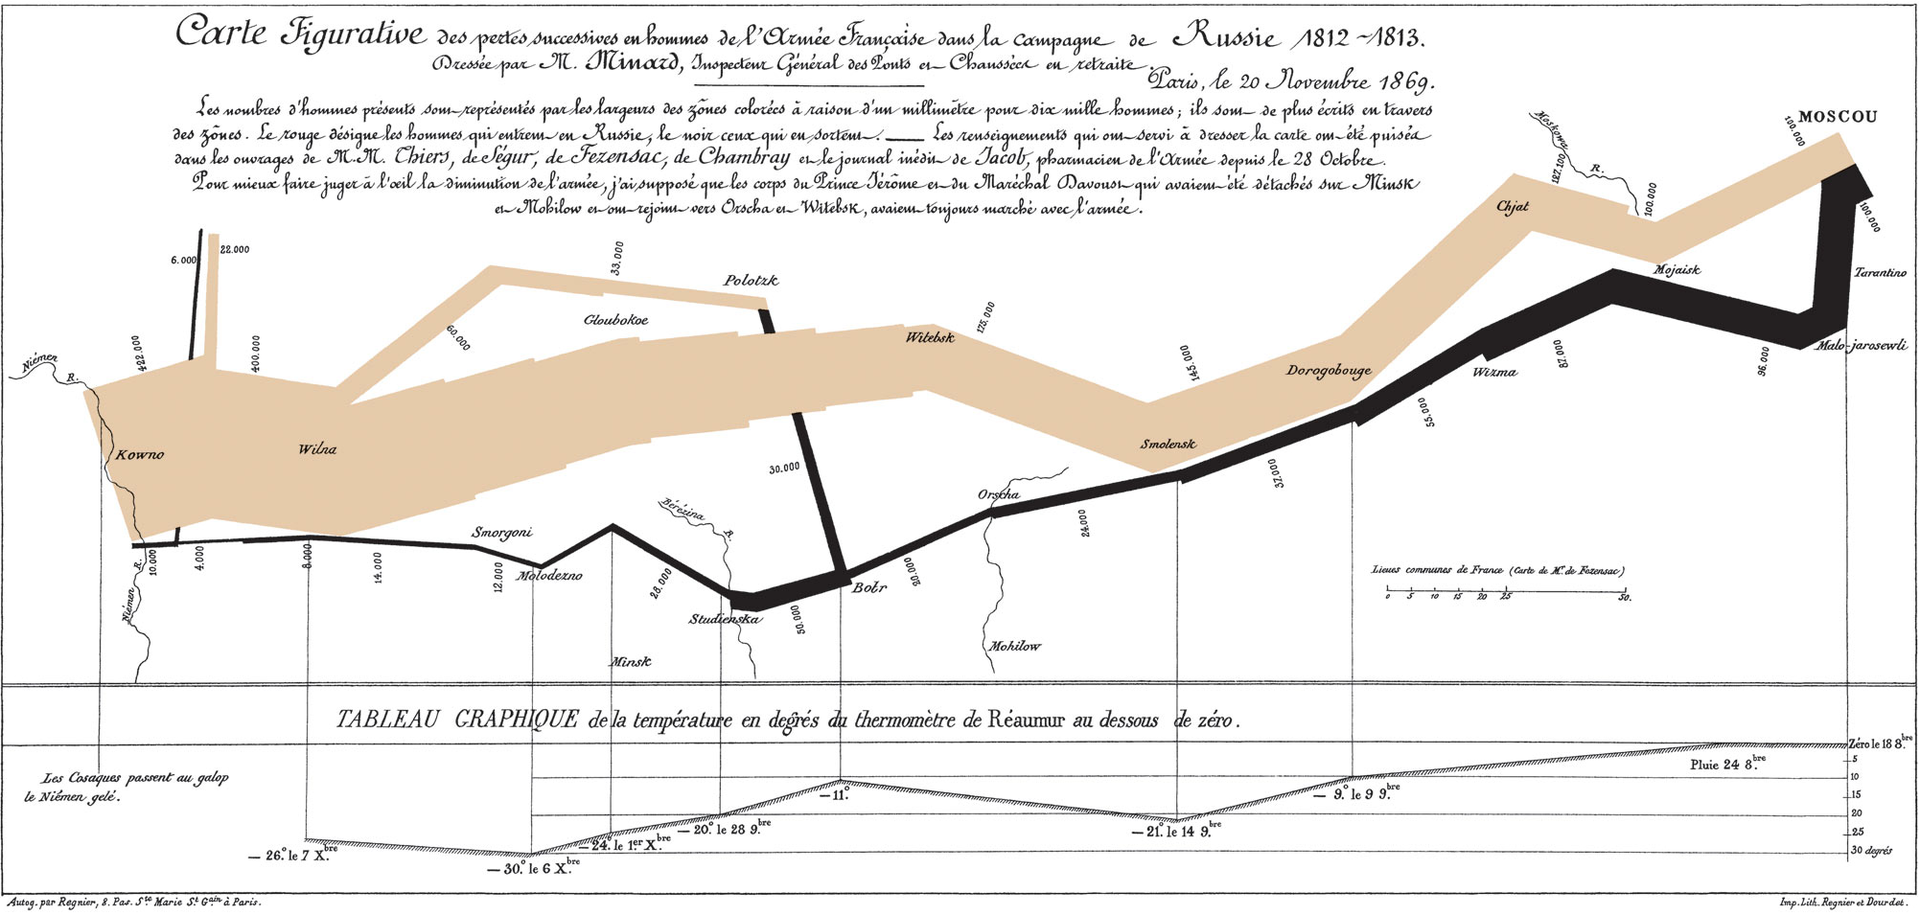
Cartographic representations are one of the oldest ways to visualise data. One of the pioneering works in the world of data visualisation, by the french civil engineer Charles Joseph Minard, is a cartographic depiction of numerical data on a map of Napoleon’s losses suffered during the Russian campaign of 1812 (that is the image I’m using to illustrate this post).
Maps can be a great way to make data more engaging and visual. Sometimes, distributing the data over a map allows us to find extra information about the dataset we are analysing – applying the latitude and longitude of crimes in a map, for instance, can make it easier to spot in which areas of the city they are happening.
However, like everything in life, when used incorrectly, maps can have the opposite effect making something difficult to understand when it can be comprehended better if represented in another way.
During this week I have worked remaking a map (the one I sent to my Data School application). The idea was to go through the same dataset but this time applying the amazing tools and techniques we have learnt to use in our first week in the Data School (believe me, it is just one week but we learnt lots of new things). From all the changes I did, I selected three related to maps to share with you:
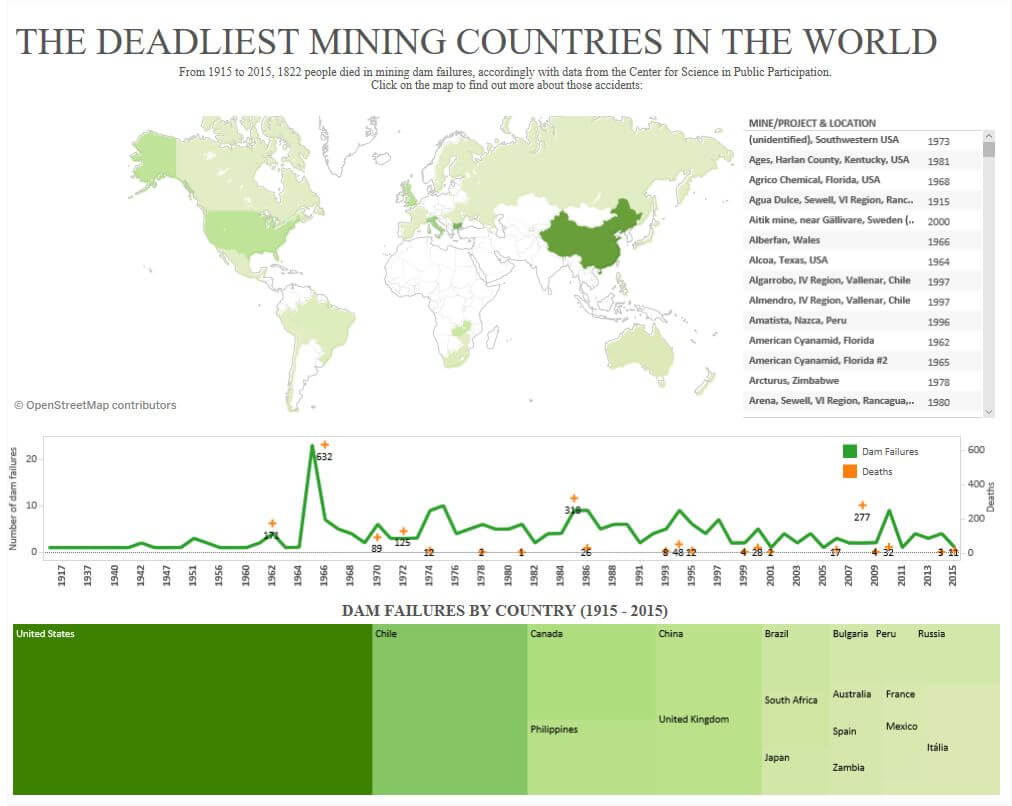
1. Filled maps can be a trap
On my application I used a filled map (the green one below) that is a good example of situations in which you shouldn’t use filled maps. 😀
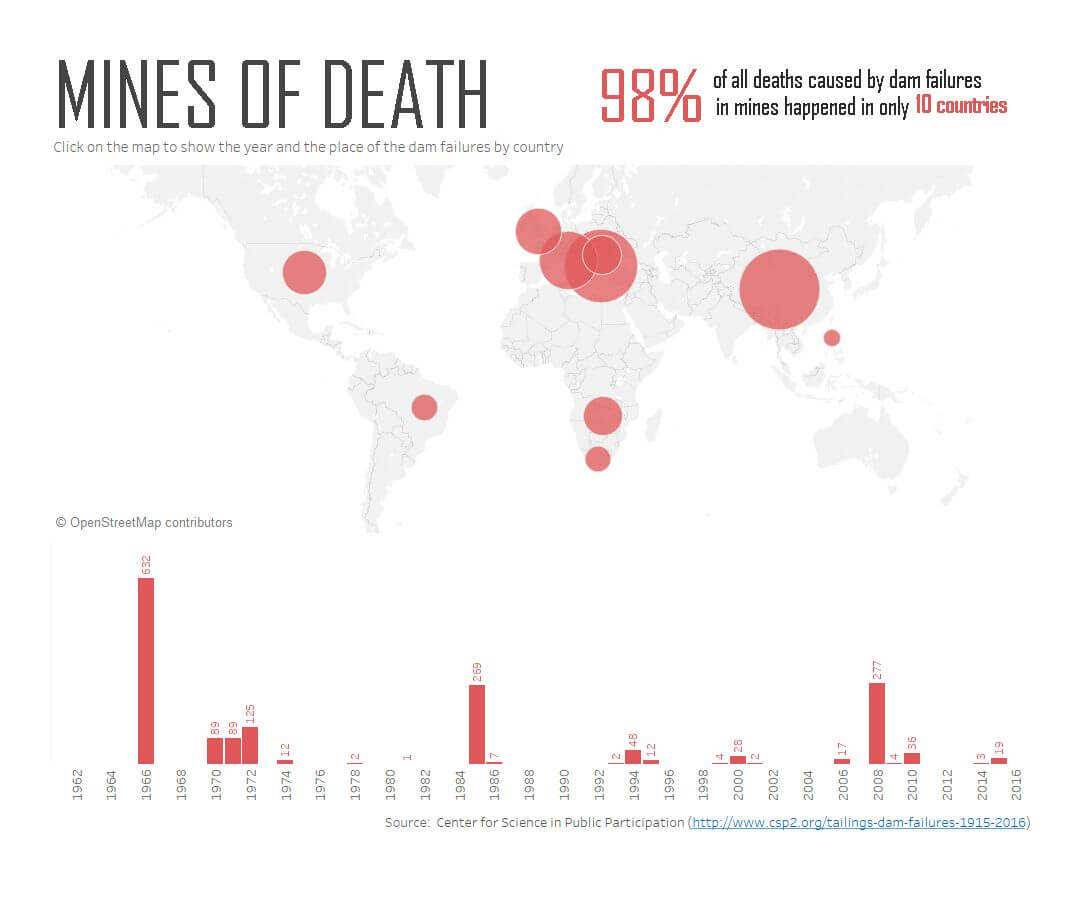
If you look the new version I did using the same data (below) you will notice that there is a huge red bubble over Europe. If you hover over this bubble you will see that it is related to deaths in Bulgarian mines, one of the countries with more deaths in dam failures, second only to China.
Now go to my first version and try to find Bulgaria! As it is a small country, chances are it will take time until you spot the dark green point in Europe and will never suspect that the country has the second biggest number of deaths! Big trap!
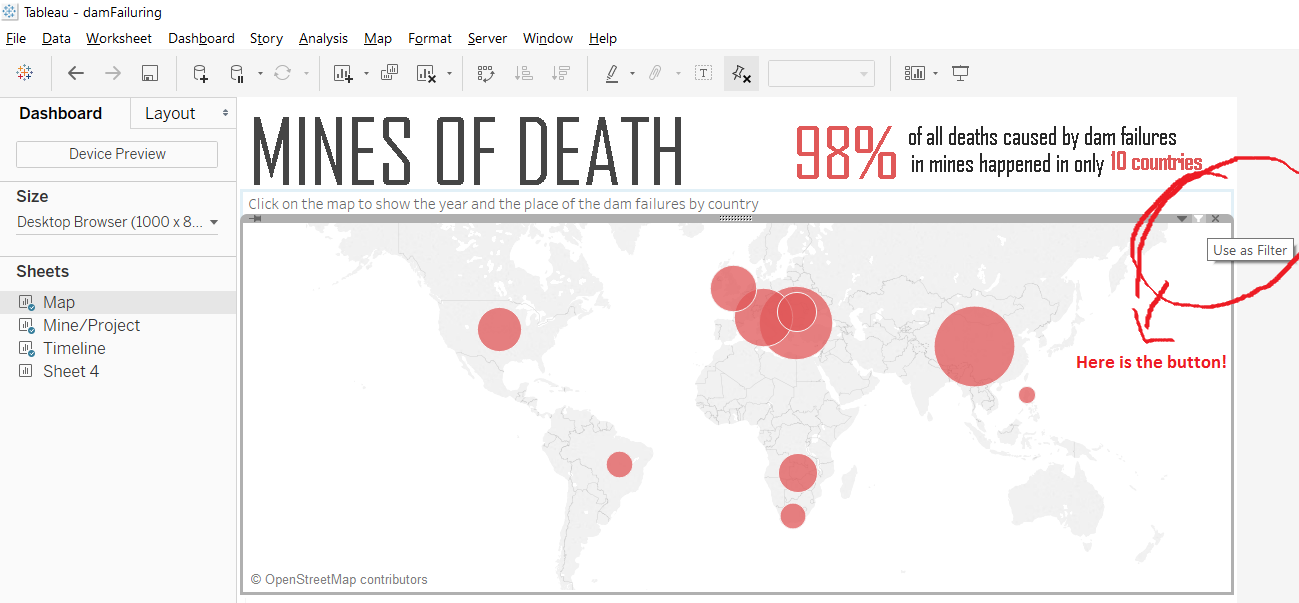
2. Why not use your map as filter?
I did it in both versions but for sure it is working better in the second. In the first, the treemap is also acting as a filter which is a bit confusing (don’t ask me why I did it I can’t find reasons).
My “favourite” part (being ironic, of course) in my first version is when you click in one of the countries in the map and the treemap turns into a huge rectangle showing basically no information. Not to mention that the treemap itself is useless in this situation. Treemaps work better to display hierarchical data, which is not the case.
But let’s forget the mistakes and talk about the good practices! In case you have never used the “Filter Function”, you can find it when you drag a sheet into a dashboard. It is the small funnel in the top (Check in the photo bellow). And remember: Don’t overuse it!
3. If you are using bubbles over a map, check that the juxtapositions are not causing problems
When I was creating my new version for the dam failures dataset all was going well until the moment I realised that my bubble for Romania was overlapped by the Bulgarian bubble. As a result, I couldn’t select Romania in the map and as you remember from above, my idea was to use the map as a filter. So it was very important to click in each one of the circles.
Overlapping is a common problem when you are working with maps and bubbles, particularly when using the size of the circles to give an additional information (in this case, the circles vary according to the number of deaths).
How to solve it? It is incredibly easy (Thanks, Andy!). You only need to order your geographical data by the measure that is determining the size of the circles. In my case, I ordered the countries by deaths, as you can see bellow.
To make it even more clear you can add a tiny border to the bubbles. Just click on “Color” in the Mark Card, then “Border” and choose a color that will not clash with your map.
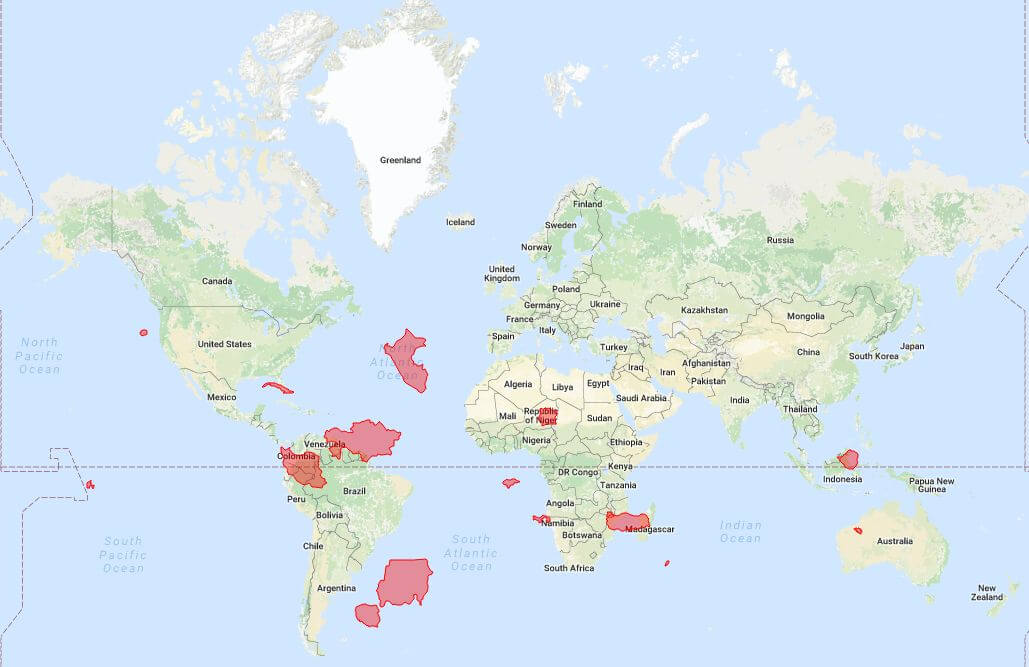
BONUS: When using maps there is always a thing we should keep in mind: There is no perfect map. The reason for this is because maps are a flat representation of a globe and there is no way to keep all proportions of a globe when drawing it as a rectangle. The most used cartographic representation, the Mercator projection, distorts the countries a lot, as you can check in this amazing puzzle (Click on the image to play):