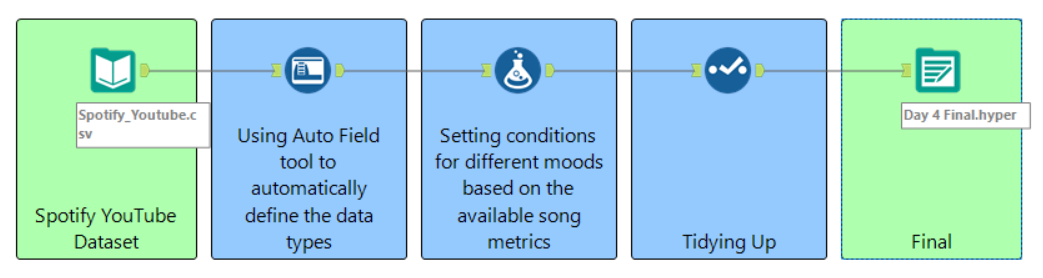
Here comes Day 4 for the dashboard week and today we are working with some music data. This is the dataset of songs of various artists in the world. Interestingly, each record is a song and has some interesting information about Spotify and YouTube platforms.
The Task
We were instructed to explore this fun dataset and come up with some musical insights. We had an option to add a supplementary dataset for extra ideas. Moreover, I decided to build a dashboard with the following objective
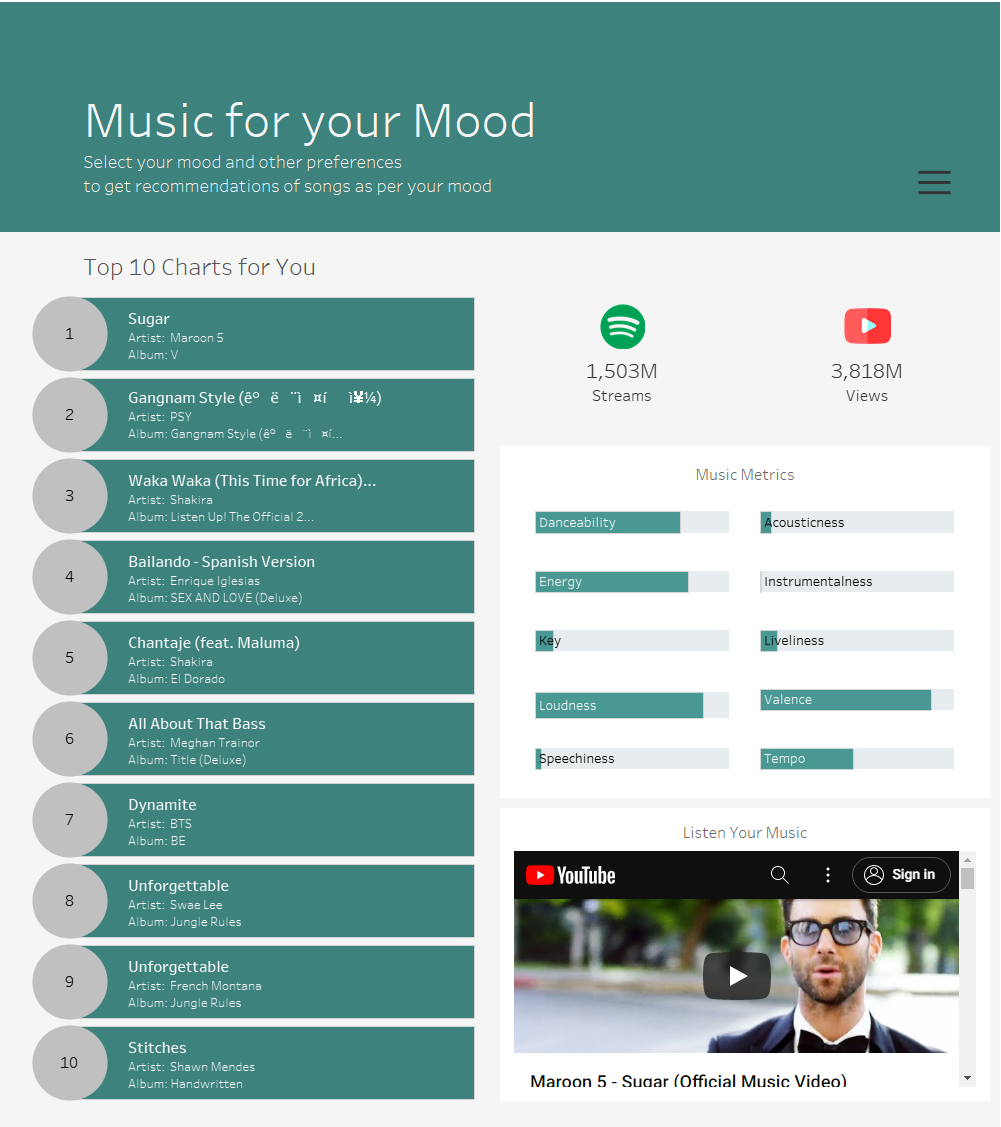
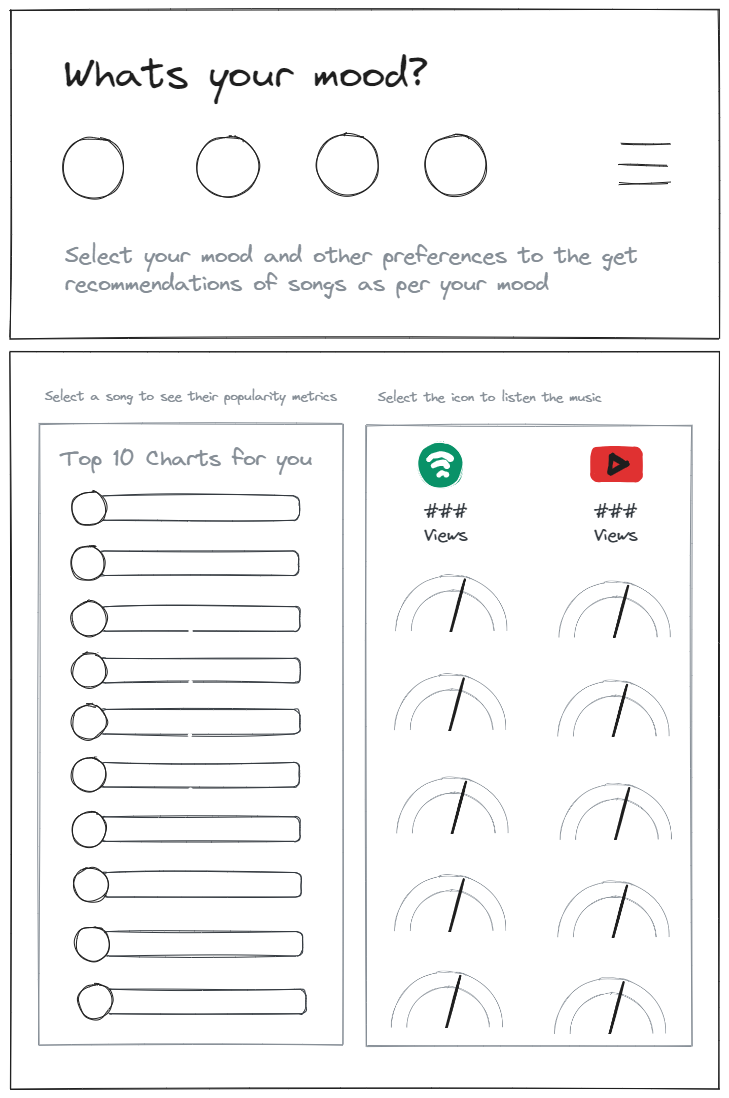
To provide recommendations of the top 10 popular songs based on the user's mood and preferences.
The Ask
- What is the mood of the user? What can be the mood types?
- How to set the threshold for the matrices?
- How to determine the popularity of songs?
- How to show the song metrics are correct as per their selection?
- Is there any way to provide the option to let them listen or watch the song?
The Data Prep
The Concept
The Dashboard