Marginal histograms are excellent for displaying your data on multiple aggregated levels in one view. Consider the following case. You have sales data and want to find out which weekday, which month and which combination of weekday and month are the strongest. With the marginal histogram, you can visualize all this information in one chart.
To build this chart, I created 3 different charts and merged them into one dashboard.
The first chart is the heatmap.
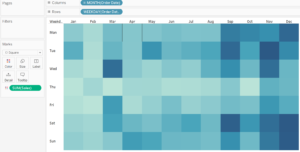
To create this chart, drag the month date to the columns shelve and the weekday to the rows shelve. Then move the measure, in our case sales, to the color mark. This creates a heatmap which shows the strongest weekday/month combination in a dark blue color.
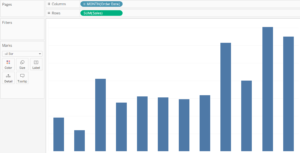
Charts 2 and 3 are bar charts.They visualize the strongest weekdays and the strongest months. For the weekdays bar chart, put weekday on the rows shelve. For the month bar chart, put months on the columns shelve.

In the next step, I combined all the 3 created charts into one dashboard. The blank objects will help you to align the bar charts to the weekday and month headers of the heatmap.
Voila! The final result is the marginal histogram chart:
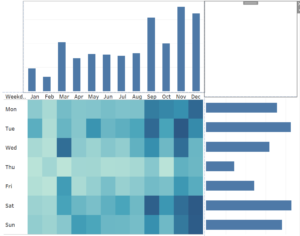
It is now easy to see that November is the strongest sales month overall. Tuesday and Saturday are the weekdays with the most sales. Saturdays and Sundays in December are the strongest weekday/month combo.