During the course of last week’s project, I was set to work creating a visualisation to allow locations to be benchmarked against the global, regional and country averaged. I decided to use one of Tableau’s newest features, set actions, to build a drill-down bar chart to allow comparison of individual rows with the higher level averages. I knew I’d need to use level of detail calculations to create reference lines for each level, so here I’ll take you through the process using the sample Superstore data set.
The first step is to identify our hierarchy. For this example, I’m going to use Segment, Category and Sub-Category. Start by building out the view with each of these dimensions on the rows shelf and the average profit on the columns shelf to give us a bar chart.
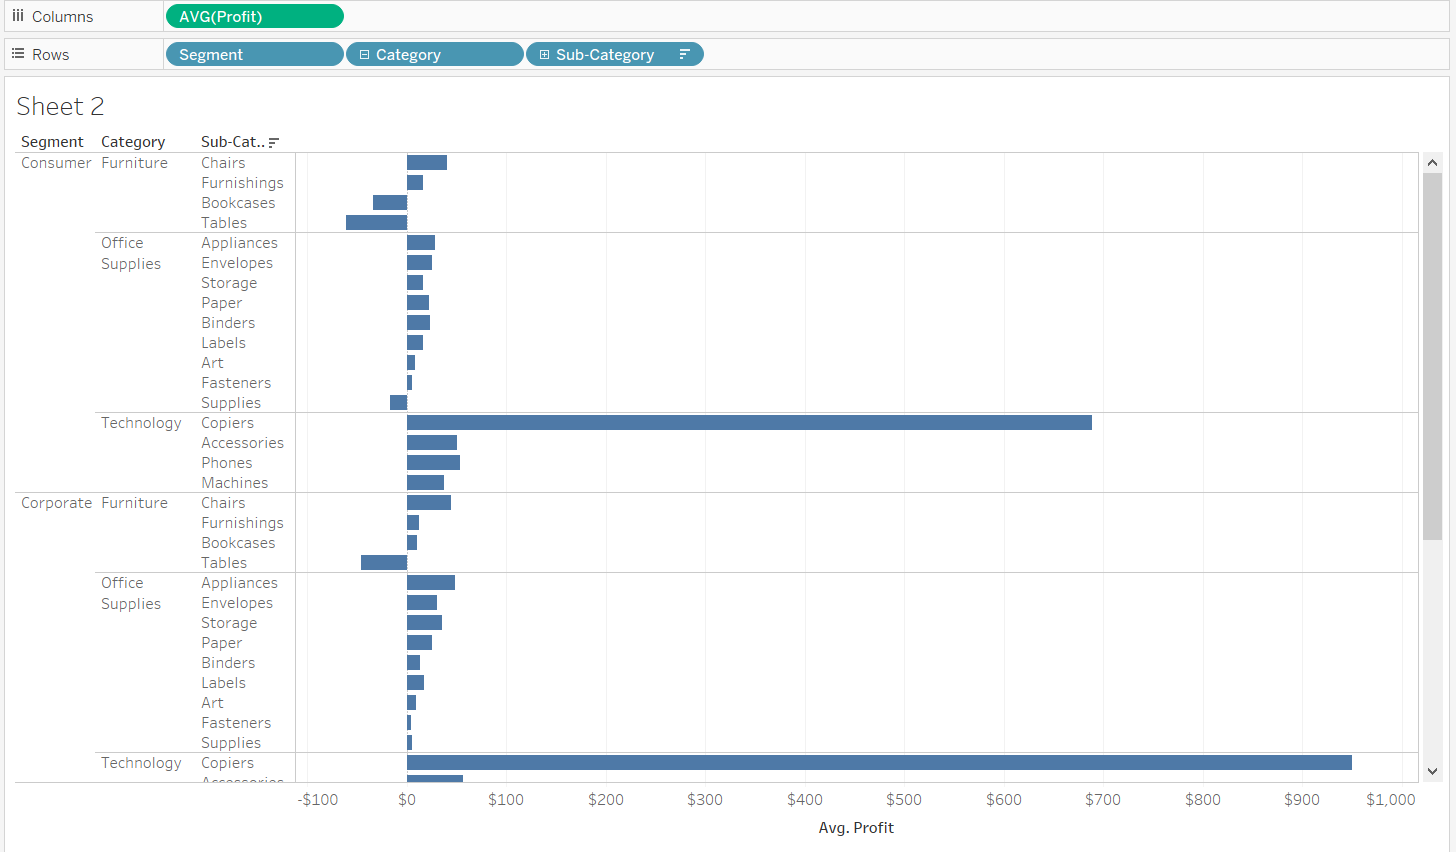
The initial view we want to iterate on with our set actions and LOD calculations
Next we want to set up some sets to allow us to set up some actions. Right click your highest level dimension from the data pane, in this case segment, and create a set. Select any values (it does matter which), give the set a name and hit okay.
Next we need to make a new calculated field that only gives us the list of categories when the set contains our specified segment. To do this, we can just use a simple IF statement:
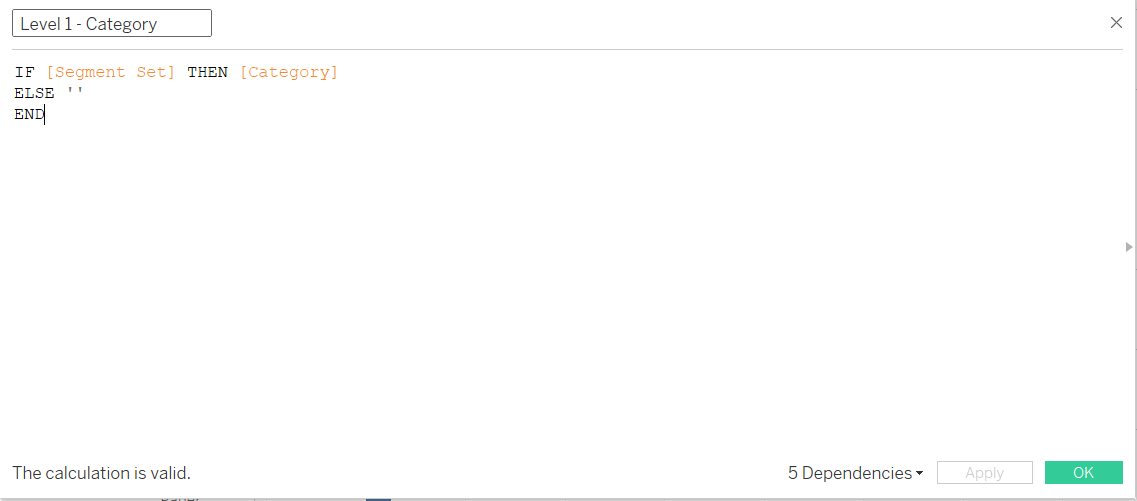
Calculation for the new category field to replace the regular category
Next, we need to create a set from the new calculation we just made. Again, right click on your new level 1 field and create a set. Select any options and give it a name.
We need to now create a calculation for the sub-category level. We can use a similar calculation as we used for level 1, but we’ll need to add in an extra condition to account for both the segment and category levels.
We can set up the calculation to look for where the new category set is selected and where the level 1 calculation is not blank, then return the sub-category for that combination.
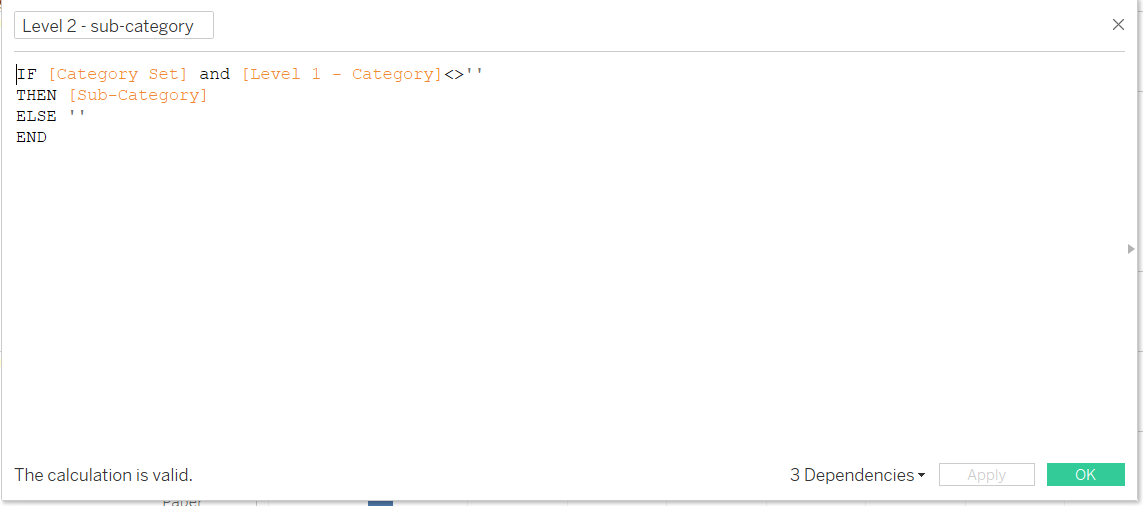
The level two calculation only populates sub-categories when a category is selected.
Replacing Category with Level 1 and Sub-Category with Level 2 will mean only the options you selected when building the set will appear. However, we want the user to be able to select whatever they want to drill down to. For that, we’ll need to make some set actions.
Create a new dashboard and add your bar chart sheet to it. Go to the dashboard actions menu (shortcut Ctrl+Shift+D on Windows) and create a new ‘Update set values’ action. Make sure your bar chart sheet is the source and update your Segment set, selecting to remove all value from the set when deselecting. Create a second action for the Category set.
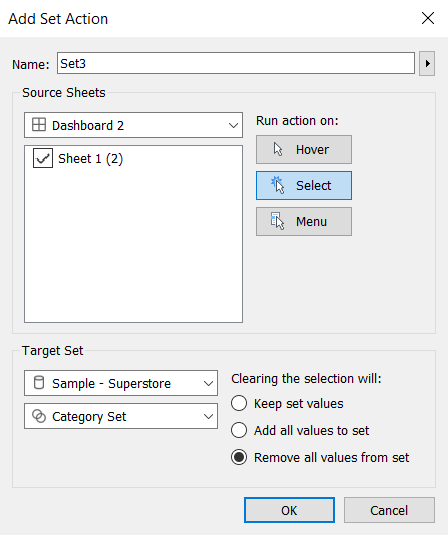
Set action set up window for the category set. The same will apply for the segment set.
Now, your bar chart should update based on which headers you click on!
Drill down bar chart, from segment to category to sub-category.
But we aren’t there yet. We want to be able to easily compare averages across the various levels. To do this, we’ll need to use an LOD to create average lines. In order to keep the line from going across the whole chart, rather than using a reference line, we can build a gantt bar to be overlayed on our regular bars.
Reference line calculation
The calculation for this is a bit of a monster so I’ll break it down into parts and explain the logic at each point.
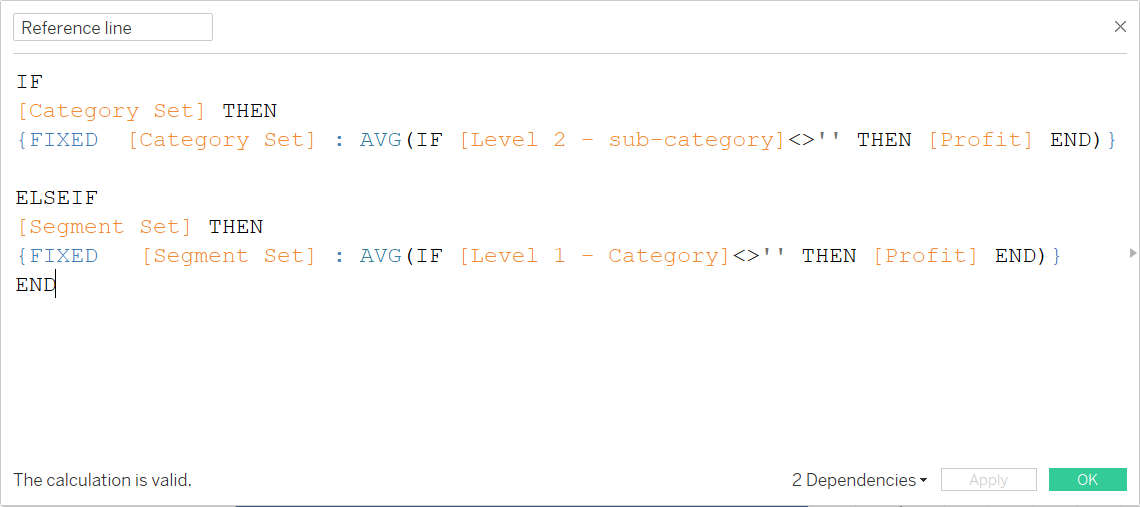
This one took quite some time to figure out…
It may seem odd, but the two parts to the IF are backwards, looking at the lower level then the higher level since if something is in the lower level it must already be in the higher level set, so the IF statement would never reach the category level if segment were the first set looked at.
The Segment Part
IF
[Segment Set] THEN
{FIXED [Segment Set] : AVG(IF [Level 1 – Category]<>” THEN [Profit] END)} END
So first we want to look at entries within the segment set (the selected segment). If we’re in that set, we want to return the value given by the LOD calculation, otherwise it will be null.
The LOD calculates the average profit as long as there are values in the level 1 field (i.e. a segment has been selected), and fixes it at the level of the segment set, which gives us the average value for that segment.
The Category Part
IF
[Category Set] THEN
{FIXED [Category Set] : AVG(IF [Level 2 – sub-category]<>” THEN [Profit] END)} END
The same idea applies to the first part, but it is fixed at the lower level and checks that the sub-category level is not blank.
These two halves are then combined together to give our IF/ELSEIF statement.
By creating a dual axis with this field and setting it to be a gantt bar, we can select a segment and have the line appear to show the segment average, then select a category to see the category average while still keeping the context of the segment values.
The only final thing to do is include an overall average line across the segments. For this we’ll need one more, much simpler, LOD:
{ FIXED [Segment] : AVG([Profit])}
And there we have it. I found this exercise to be a great use case for when LODs are ideal, as well as thinking about building logically IF statements.
Quite a lot of time was spent on working out how to make the reference line work when all I needed to do was switch the statements around!
The final chart with dynamic reference line and the overall average for the segments