Using Tableau’s Superstore as the database, the SQL query:
Select [Region], [Order Date], Sum([Sales]) as ‘Sales’
From superstore
Group By Region, [Order Date]
;
creates a table with column headers Region, Order Date and Sales, where the Sales is the sum of sales for each order dates in each region and outputted as:
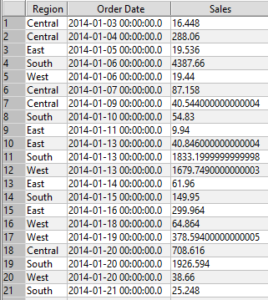
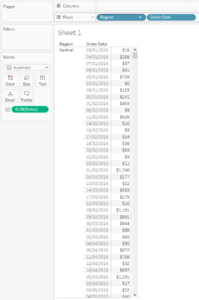
In the SQL query the ‘Select’ brings back the data that is needed from the database, the ‘as’ following the aggregation of a measure names the column it will fall into, the ‘From’ tells SQL where to pull the data from and the ‘Group By’ is the level in which the measure is aggregated to. This table can be displayed in Tableau as:
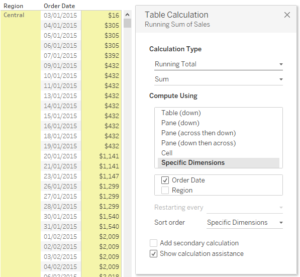
Running Sum:
If we want a running sum in the Tableau table we can add a Table Calculation. If we want the running sum to be broken up by Region then editing the Table Calculation and unticking the Region box under specific dimensions. Then we have:
To do the running sum in SQL we have the query command:
Sum(Measure) over (Order by Dimension)
and to add in the breaking up running sum by Region we use the ‘partition’ command:
Sum(Measure) over (Partition by Dimension Order by Dimension)
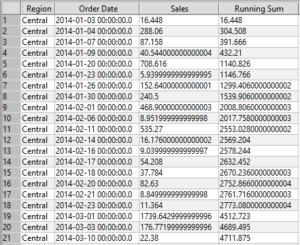
So in order to get the same running sum as in Tableau we use:
Select [Region], [Order Date], Sum([Sales]) as ‘Sales’, Sum(Sum([Sales])) over (Partition [Region] Order By [Order Date]) as ‘Running Sum’
From superstore
Group By Region, [Order Date]
;
Which then returns the table:
Moving Average:
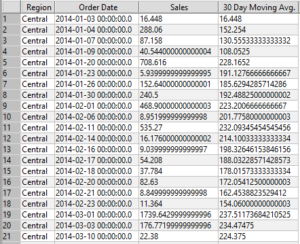
To add in a moving average, say 30 day moving average, the Tableau Calculation can be changed to Moving Calculation, the Summarise Values Using changed to ‘Average’ and the previous changed to ’29’. This Table Calculation then makes:
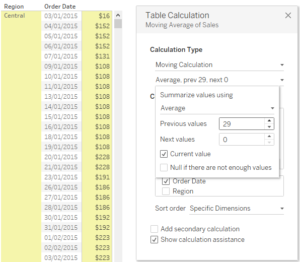
For the SQL query we use is similar to the query before however the first Sum becomes Avg and the number of entries averaged over needs to be given. To have a 30 point moving average as before the brackets following the ‘Over’ needs to include ‘Rows Between 29 Preceding and Current Row’; this is saying take the values from the previous 29 entries of the Order Date and the current value and average their measure. This gives the command:
Select [Region], [Order Date], Sum([Sales]) as ‘Sales’, Avg(Sum(Sales)) Over (Partition by [Region] Order By [Order Date] Rows Between 29 Preceding and Current row) as ’30 Day Moving Avg.’
From superstore
Group By Region, [Order Date]
;
Which then returns the table: