For the final day of dashboard week we were tasked with reapplying to the Data School by using the same dataset the new incoming cohort used during their final interview. The dataset being used is Gift Travel Filings.
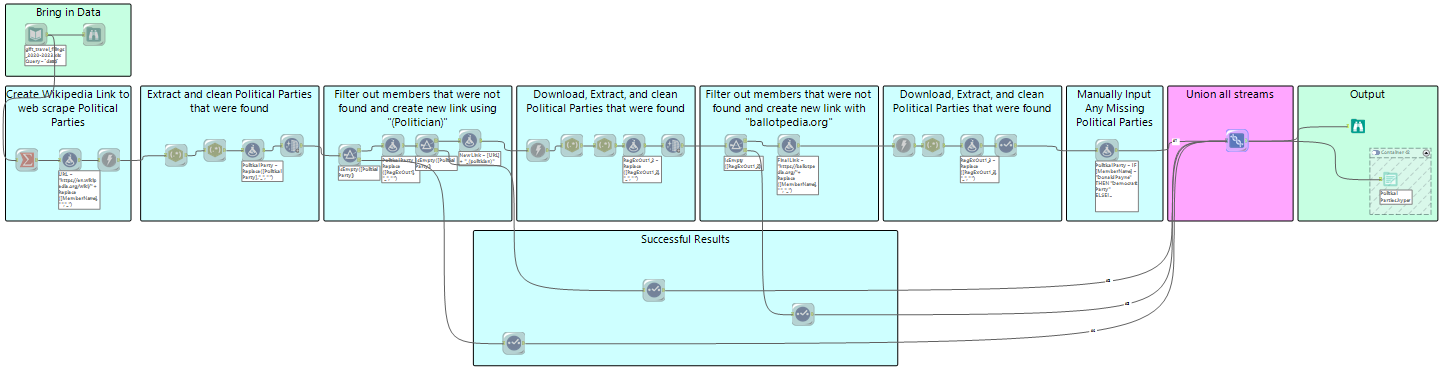
When exploring the dataset, I realized that it would be interesting to have the political parties of congress members and see how their political standings affect the travels they make. In order to do this, I had to web scrape several sites in Alteryx.
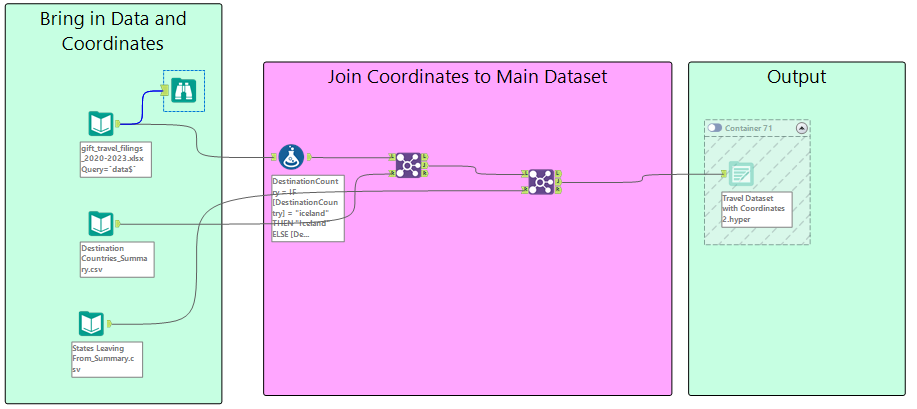
Another step in my dataset creation was to create a flow map that showed the different travels and in order to do this I had to go into Tableau and download the generated Latitude and Longitude coordinates of the origin and destination locations. After downloading these datasets, I was able to create a completed dataset to use for my dashboard.
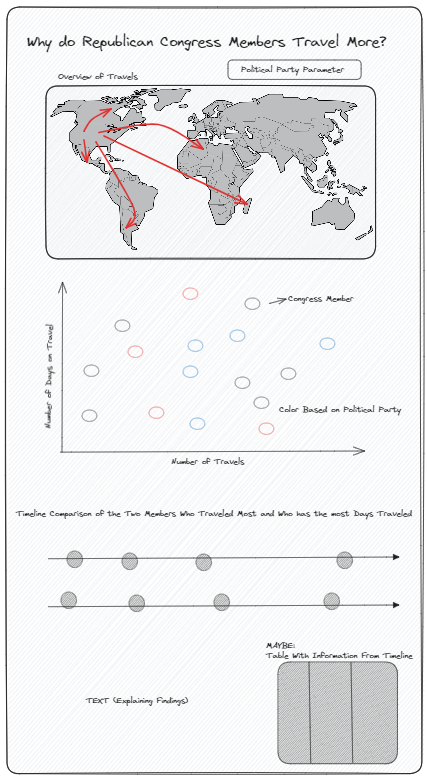
After having my dataset ready, I started planning my dashboard design based on members with the most trips and the members with the most days spent traveling, all of which were done by members within the Republican party. I wanted to explore this further and decided on the following dashboard template: