During the second week at the Data School, we reached Tableau Intermediate level. The coaches taught us a lot of useful features and tricks which I really wish I knew when I first started using the software. Here are my top 5:
1. The Data Interpreter
The Data Interpreter can help you clean your data if your source is not in a perfect table format. This feature detects formatting such as empty columns, white space, titles, stacked headers, notes, etc, and with a click of a button, automatically reshapes the data into a ‘clean’ table with columns and rows, ready for analysis.
For example, consider the below excel table.

When loaded in Tableau, the fields look like this:

With a simple click on the ‘Use Data Interpreter’ button, Tableau cleans up the irrelevant data in the table. Et voilà! This saves you time opening and reshaping your excel.

Note: The Data Interpreter supports Excel, CSV, Google Sheets, and PDF. More information here.
2. Pivoting Data
Looking at the same excel example, you may notice that the 4 types of cars (red, silver, black and blue) are spread into 4 columns. This structure will make it difficult to visualise in Tableau.
Luckily, the pivot allows us to combine the 4 types of cars columns into one.

You will notice that the newly created rows contain the titles of the columns within them – e.g. ‘Types of cars Black Cars’. Simply click on ‘Aliases’ from the drop down menu under the ‘Car Types’ column and edit the values as shown.

3. Blue vs Green Fields
A simple way to summarise the difference between Blue and Green fields is Discrete versus Continuous. Blue fields are discrete – they contain a finite number of values and will split your data into categories. Green fields are continuous – they contain an infinite number of values and will draw an axis when you add them to the columns or rows shelves.
Discrete fields are usually qualitative data such as names, regions, products. Continuous fields are usually numeric, quantitative values that you can aggregate such as sales and profit.
Note: blue fields are not necessarily always Dimensions and the green fields are not always Measures. You can turn a dimension into a measure at any time just by dragging the field into the other section, and vice versa. More information here.
4. Types of Joins
You will often find yourself wanting to bring in additional data to your existing source to supplement your analysis. If you have two tables with at least one column that is the same in both, Tableau allows you to join them side by side.
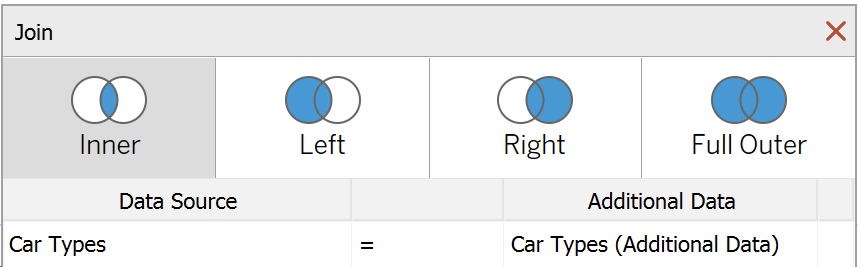
There are 4 types of joins you can use in Tableau Desktop: inner, left, right, full outer. Tableau will also prompt you to select the fields you are joining on (the two columns that contain the same type of data).
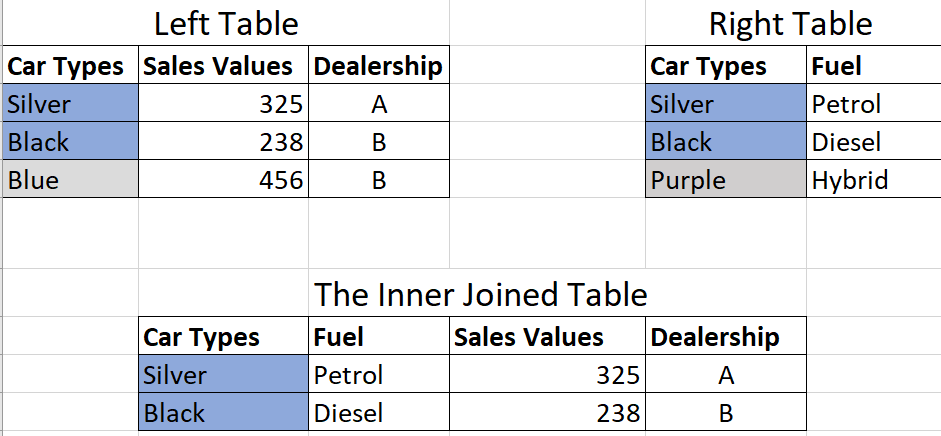
The Inner Join
Consider the below example, where the first column in both tables contain the same information – ‘Car Types’. The second table brings in fuel type information. However, it has no fuel information about blue cars, and it has one different car type to the left table – purple.
An inner join will takes only the fields that are common to both tables. The result is a table that contains values that have matches in both tables.
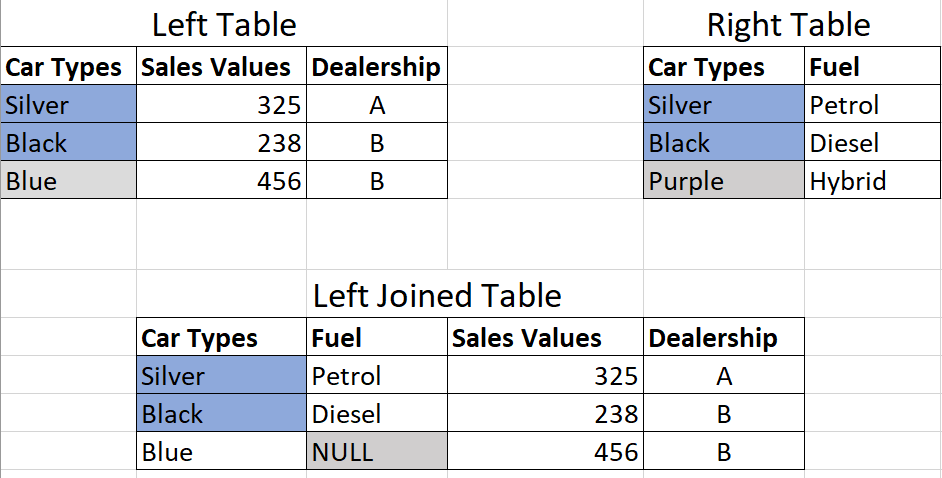
The Left Join
The left join combines the two tables only on the fields that match the left table, i.e. silver and black car types. If a value in the left table doesn’t have a corresponding match in the right table, you will see a NULL value in the joined table.
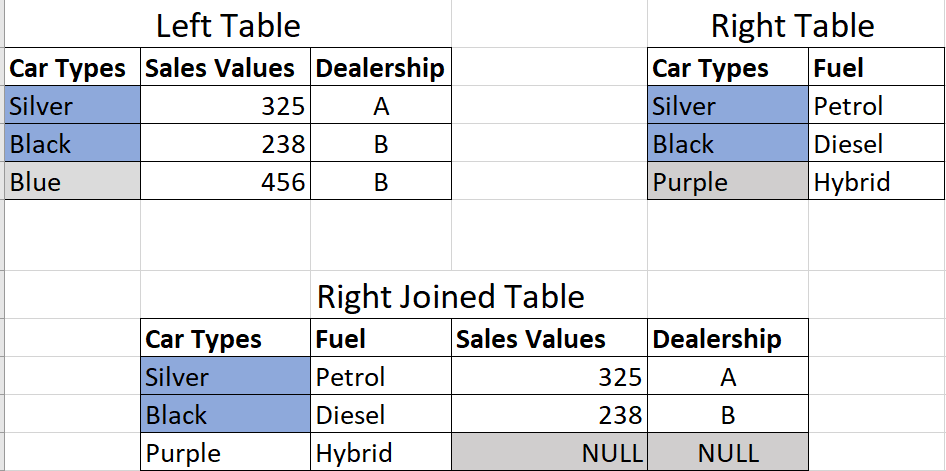
The Right Join
With the same logic, the right join combines the two tables only on the fields that match the right table, i.e. silver and black car types. On this example, the purple cars exist only on the right table, so Tableau will display NULL values in the ‘Sales Values’ and Dealership’ columns from the left table.
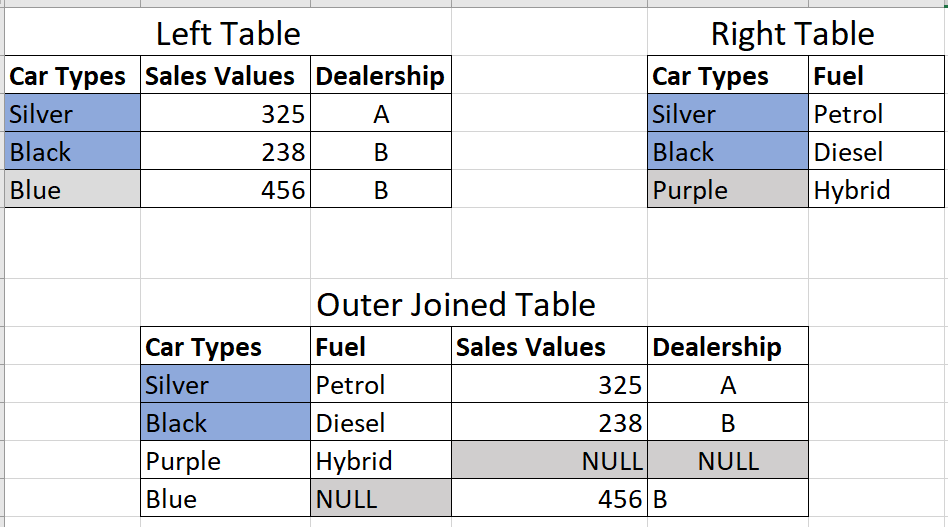
The Full Outer Join
The full outer join combines all values from both tables. If a value from either table doesn’t have a match in the other table, you will see a NULL in the joined table.
Note: You can also combine two tables of data using a union. The union brings new rows of data from one table to another. Ideally, the tables that you union will have the same number of fields, and those fields have matching names and data types. In contrast to joins, which produce wider tables by adding in new columns, unions only add new rows, making your table taller. More information here.
5. Order of Operations and Filtering
Tableau has a specific order of performing various actions (operations) and applying filters. This is important to know as your results may change depending on which filters you apply and the order you apply them in.
The order of operations includes all the elements in the following image. Filters are shown in blue, and other operations, which are mostly calculations, are shown in black.

If you have any questions about this blog post, or would like to chat about Tableau in general, do not hesitate to get in touch on Twitter @nataliatamiteva.