To be able to understand LOD’s we must first understand the basics of how Tableau visualises the data in your view.
Dimensions can be dragged onto different shelves within a sheet to provide a level of detail to your viz. Depending on the dimension that you choose to view, your data will be aggregated accordingly. Adding more dimensions to your view will increase the granularity but reduce the level of aggregation.
This blog uses the Sample – Superstore data set.
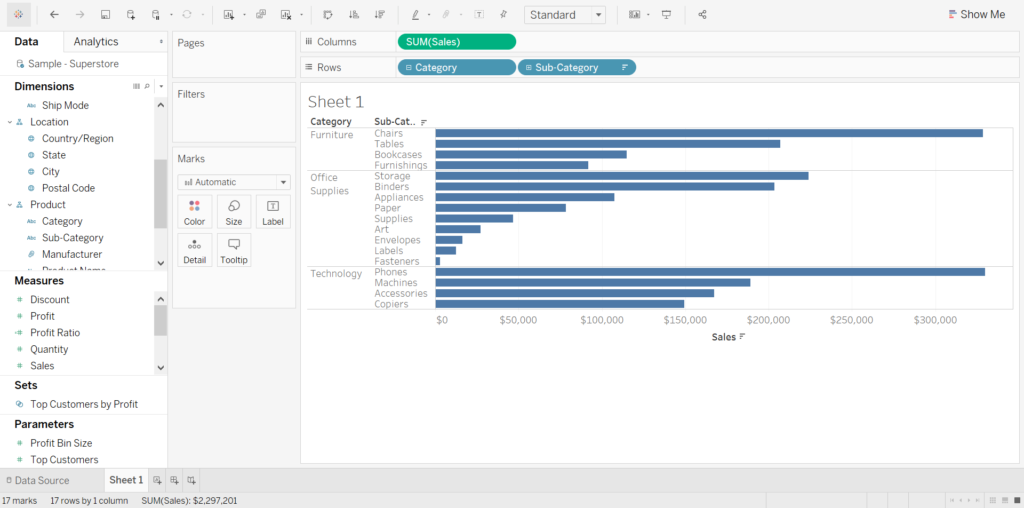
For Example if we wanted to see Sum(Sales) for each Category in our product portfolio. We would drag Sales (a Measure) onto columns shelf and Category (a Dimension) onto our rows shelf to produce the below.

Sales has been aggregated to a sum and is showing us the sum of sales for each category as this is the level of detail we have specified for this viz. As we have 3 product categories, we will get 3 marks.
If we now wanted to see the sum of sales for each Sub-category within each product category, we would drag Sub-category onto the rows shelf. This would affect our viz as we now have 17 marks in our view which each represent a sub-category. As we have added another dimension to the view our granularity has increased however this has resulted in a less aggregated viz level of detail (as we are now seeing sum(sales) per sub-category).
However we may not want our initial visualization to change when we change the granularity of our view which is when LOD expressions are useful. They allow you to change the level of detail using a specific dimension, but without referencing the dimensions in your view.
Example 1
If we were to drag Sales onto Rows and Sub-Category onto the text marks card, we would get a view that shows us the sum(sales) for each product sub-category:
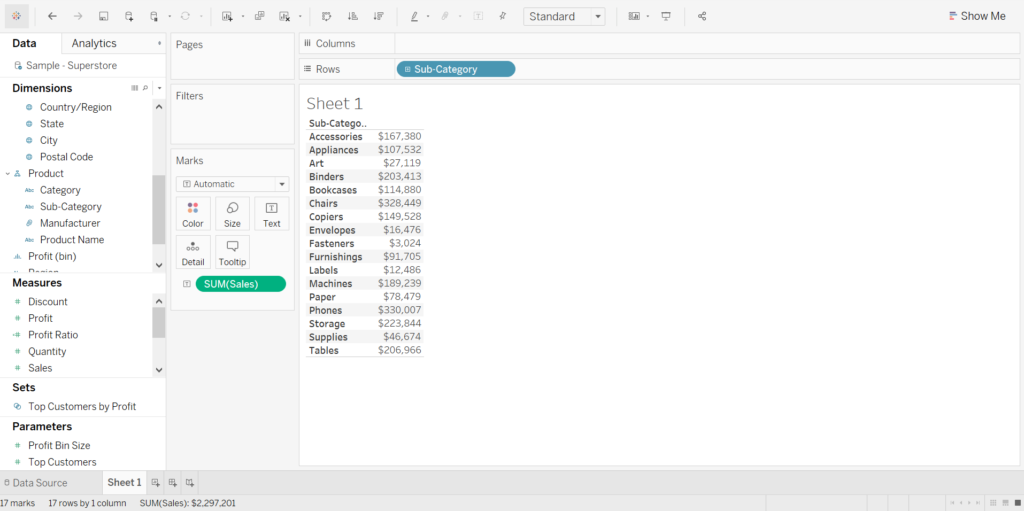
This chart is showing us the sum of sales at the Sub-Category level of detail – 17 marks in total as we have 17 sub-categories.
Now, say we wanted to see the sum sales for each category instead, we could use a Fixed LOD expression.
To compute this LOD expression, let’s follow these steps:
- All LOD expressions must be written within curly brackets { }
- We are writing a fixed LOD expression therefore start by writing fixed within the curly brackets {fixed….
- We now need to specify which level of detail we would like to fix our expression on. For this example it would be [Category]
- Add a :
- Lastly, we need to confirm which aggregate expression we would like to compute for our fixed level of detail sum(sales)
These steps create the following expression:

This is asking Tableau to give us the sum(sales) for each Category (which will then become its own Column named Sales per Category).
Lets now pull this LOD expression into our view by removing sum(sales) and dragging ‘Sales per Category’ onto the text marks card. Our view now looks like this:

What has changed?
We still have 17 marks as Sub-Category remains on our rows shelf however the values within our table have changed. As we have dragged on our fixed LOD, our view is now aggregated to the [Category] level of detail as that is what we wrote within our expression. But notice that our Category dimension pill is not in the view.
Another way to demonstrate how this LOD is working is by dragging Category into the view:

We can clearly see that the table is showing the sum(sales) for each Category rather than each Sub-Category as this is the level of detail we specified in our fixed LOD expression.
Example 2
Say, as a manager at Superstore, we wanted to understand when our customers made their first purchase with us and whether these customers continued to purchase in future years. To visualise this we would need to calculate the minimum year we have recorded for each customer using an LOD expression:
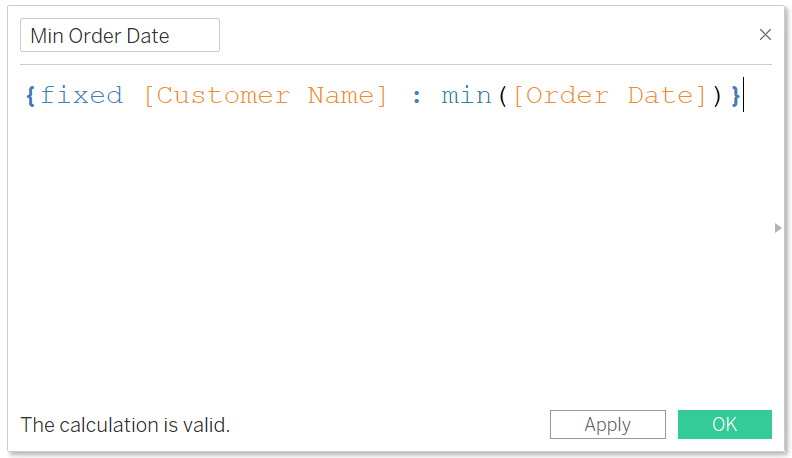
This expression would give us the minimum Order Date for each Customer Name. We can test this expression by firstly dragging Customer Name and Order Date onto the columns shelf.

Here we can see, for each customer name, the years in which they have placed orders. For example Aaron Hawkins has made purchases in 2016, 2017, 2018 and 2019.
Now, to see the first order date (or min order date) for each customer name, drag the LOD expression Min Order Date onto the text marks card.

In this column we can now see the first year that each customer made a purchase. Looking at Aaron Hawkins again we can clearly see that 2016 was the first year he purchased.
So now, to build our visualisation, drag Order Date onto the columns shelf and Sales onto the Rows shelf:

Using our LOD expression, we want to break up our view to show each customer’s min order date. Therefore drag the LOD expression onto the colour marks card:

Each colour represents a ‘Cohort’ of customers and is breaking up each bar depending on when a customer made their first purchase. We can clearly see that those customers who purchased in 2016 (represented in blue) have been consistent/ loyal customers and continued to purchase in 2017, 2018 and 2019.