..3 hours to create a dashboard and write a blog post,….
Today we are tasked with creating a dashboard, finding insights on the following:
- Babies per Woman
- CO2 emissions
- Child mortality
- Income
- Life Expectancy
We started as a team to join the data together and then brought it into Tableau to work on it individually.
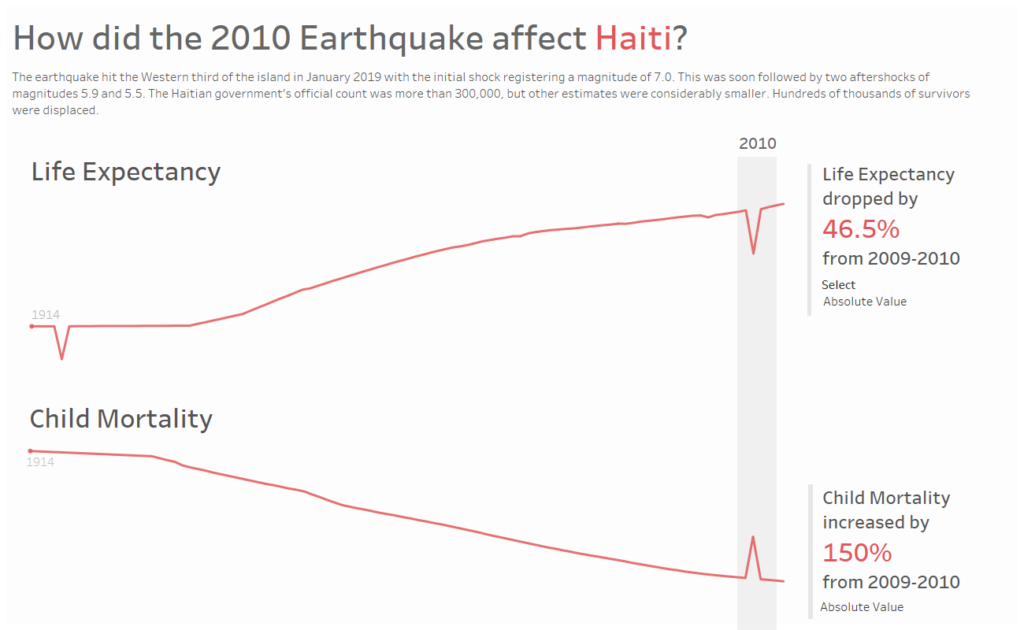
I planned to focus my data early on to ensure i had enough time to finish both the dashboard and the blog. I discovered that Haiti had some big outliers for some of the indicators so decided to explore them further. The outliers were for both life expectancy and child mortality and they both significantly changed in 2010. After doing some research i discovered that this was the year Haiti was hit by a large Earthquake. I decided to focus on this.
My Final Dashboard: