Dynamic Tooltips
For this topic I am looking into the average adjusted inflation gross versus budget for each of the Disney Renaissance films. Link to dataset.
A dynamic tooltip provides Tableau users a little more flexibility in what they would like to inform others.
Whenever creating a worksheet, Tableau produces a default tooltip as seen below.
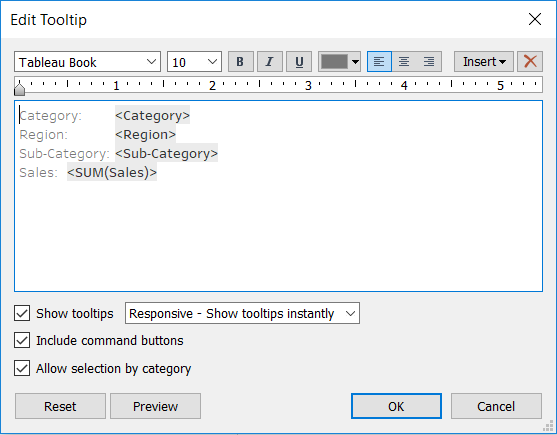
Image 1: Default tooltip produced by Tableau
I am not particularly a big fan of these sorts of tooltips because sometimes they do look quite busy. I prefer the less is more look.
You can alter your tooltips to be a bit easier to read like in Image 2 below.
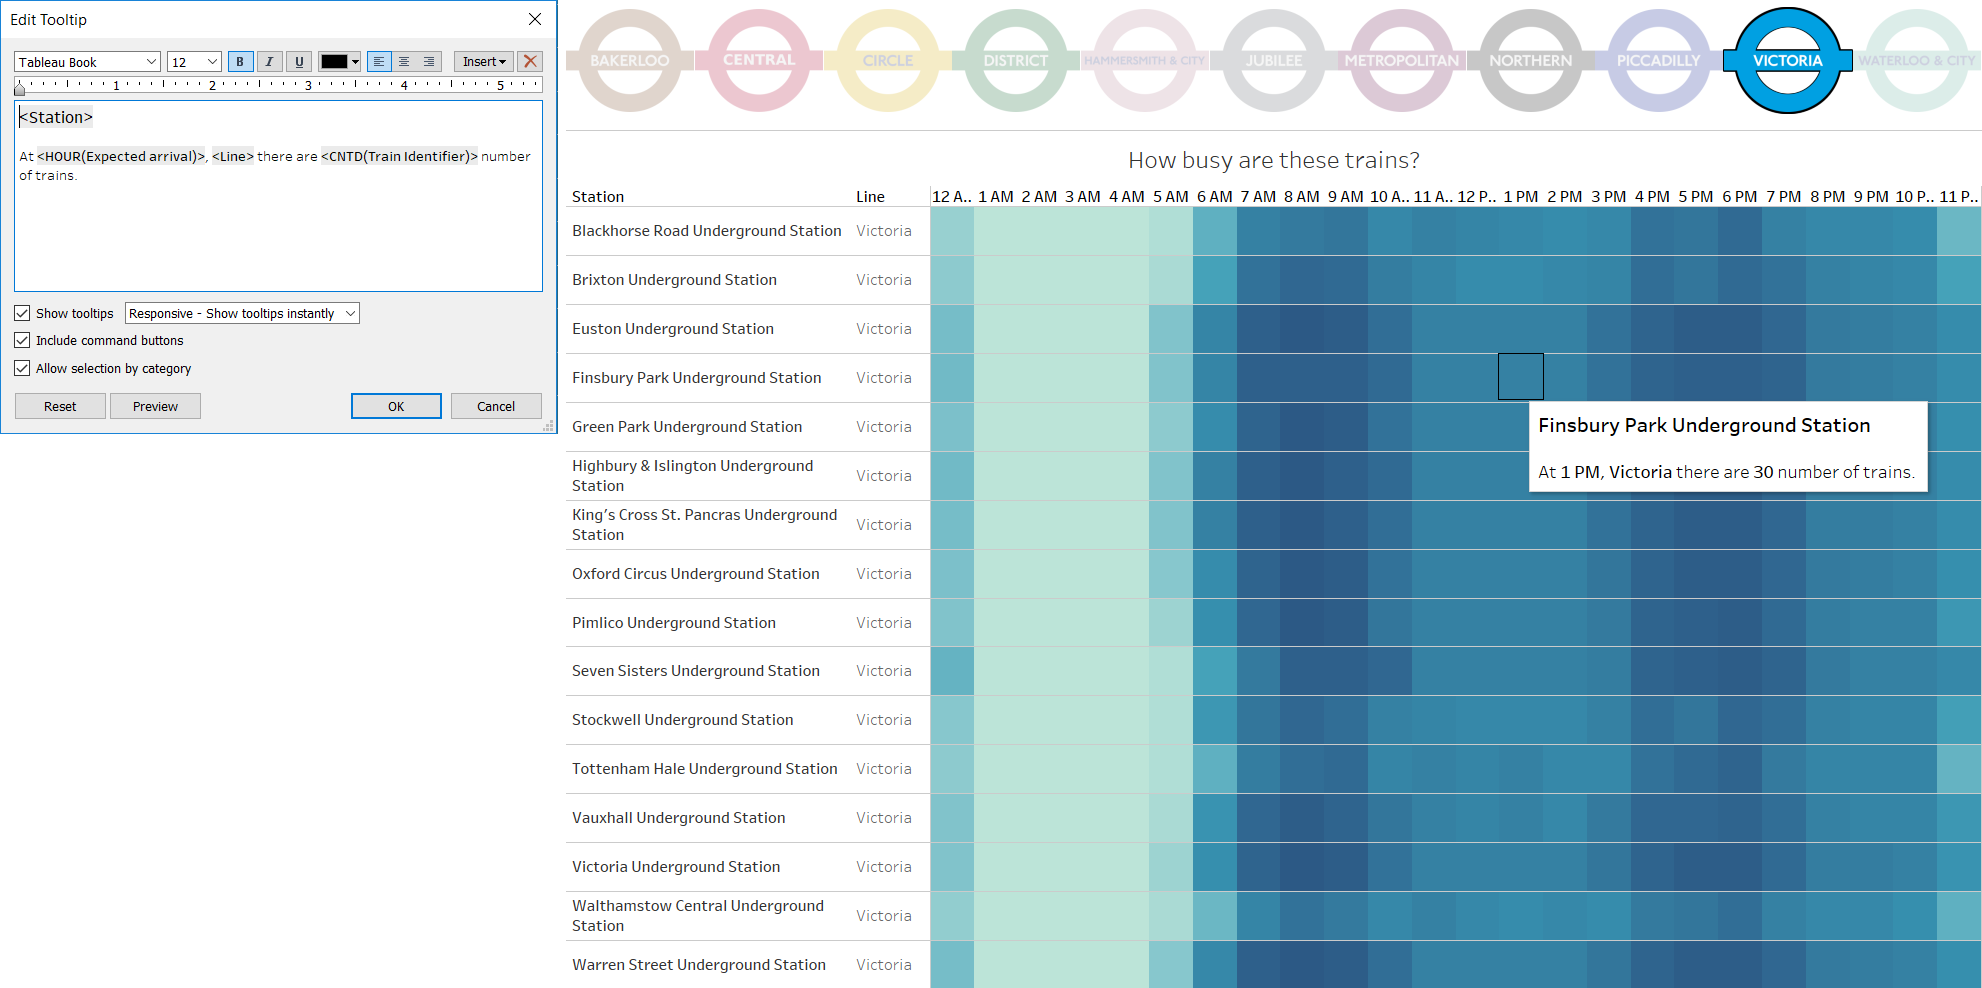
Image 2: Tooltip edited to make it more user friendly
While I do prefer these tooltips more, the issue that I face with these is that sometimes I want my tooltips to have a bit variety, where the text would change for a particular data point based on a condition.
For example, in Image 2, for every data point that you hover over on the heat map, it will provide the corresponding information based on what is provided in the tooltip. In this viz it works well because I do not want to tell anything more than that.
However, in my butterfly chart, in Image 3, I am looking at the films in the Disney Renaissance and drawing a comparison between their budget and how well they did in the box office. I want every film to display their adjusted inflation gross value and their budget in the tooltip, all but The Lion King. I would like The Lion King to instead say something else entirely.
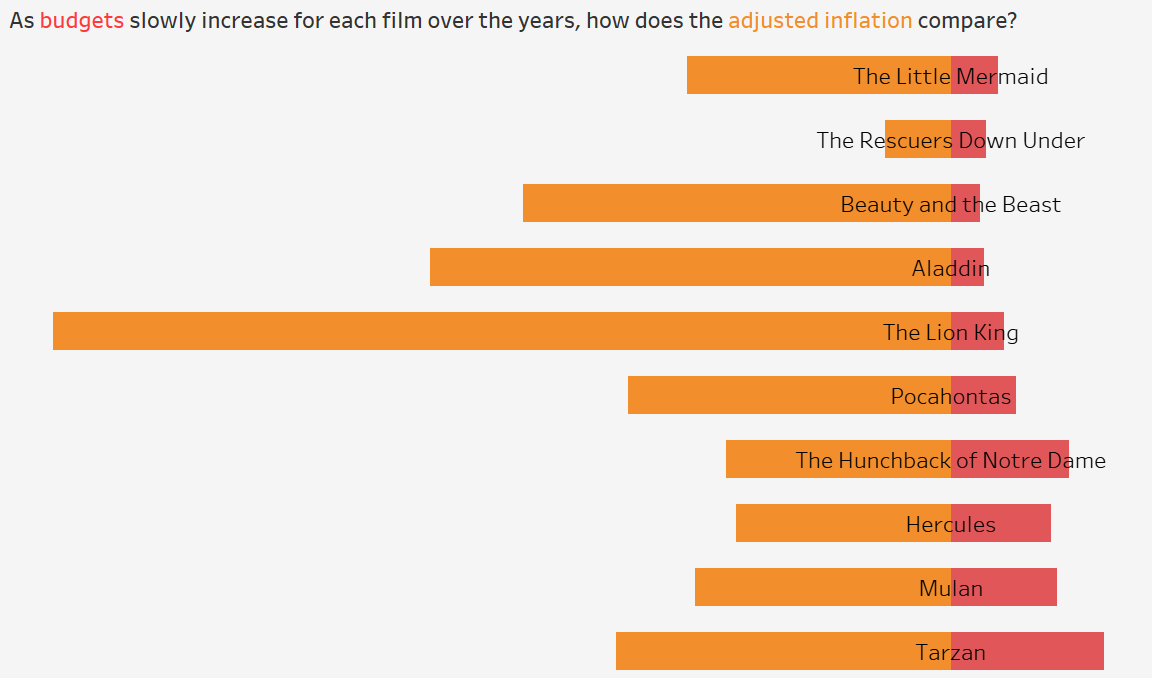
Image 3: Butterfly chart comparing budget and inflated gross for films in the Disney Renaissance
Why? Well, if you take a look at the chart you’ll notice that The Lion King had one of the lowest budgets, but it had actually grossed the highest in comparison to the rest of the films in the Disney Renaissance. This is something that I would like to mention in my viz.
(To see how to make a butterfly chart click on Image 3.)
But how can I mention a films’ adjusted inflated gross or budget while mentioning something completely different for particular film in ONE tooltip?
Here’s how:
Created a Calculated Field for both Budget and Inflation Adjusted Gross:
CASE [Film]

WHEN "The Lion King"

THEN "The Lion King had one of the fewest budgets of $45,000,000 in comparison to the rest of the
Disney Renaissance films, yet it had garnered the highest adjusted inflated gross of $761,640,898."

ELSE [Film] + " had a budget of $"+STR([Budget])

END
Change the text for accordingly Inflation Adjusted Gross.
CASE [Film]

WHEN "The Lion King"

THEN "The Lion King had one of the fewest budgets of $45,000,000 in comparison to the rest of the
Disney Renaissance films, yet it had garnered the highest adjusted inflated gross of $761,640,898."

ELSE [Film]+ " had an average adjusted gross of $"+STR([Inflation Adjusted Gross])

END
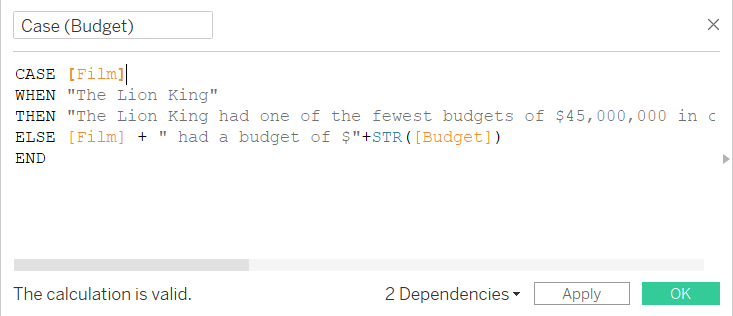
Image 4: Calculation entry for Budget
Drag the calculated field to the appropriate tooltip and you’ll see an ATTR dimension pill with a tooltip logo in the Marks card.
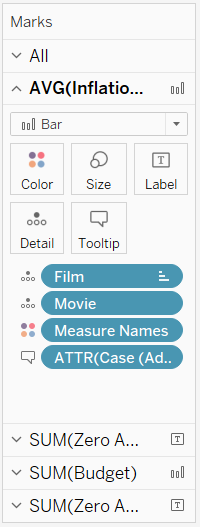
Image 5: ATTR pill of calculated field in tooltip found in Marks card
Insert the ATTR budget and adjusted inflated gross calculated fields into its corresponding tooltip as seen in Image 6.
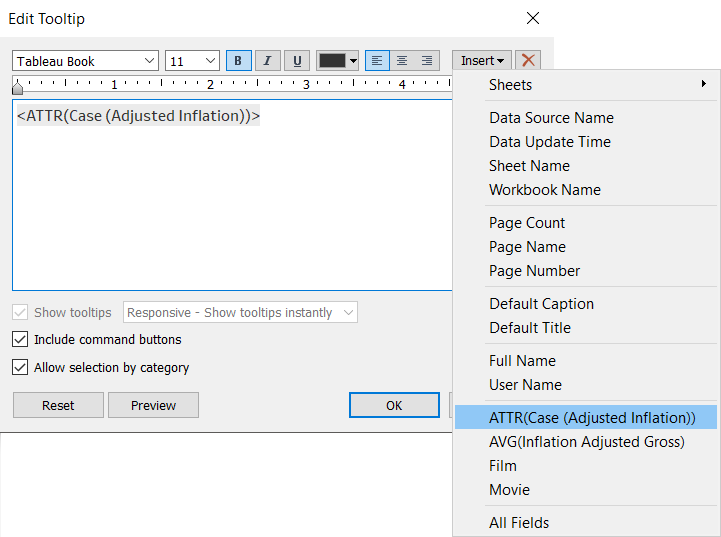
Image 6: Insert the ATTR calculated field into the tooltip
After that, you’re dynamic tooltip should work!

Tooltip should change when on The Lion King
