How to make butterfly chart using Tableau
I am looking into the average adjusted inflation gross versus budget for each of the Disney Renaissance films. I thought the best way for me to compare the two was by doing a butterfly chart on Tableau. Link to dataset.
Before producing the chart, I have filtered out all the films that were not part of the Disney Renaissance in the Data Source beforehand.
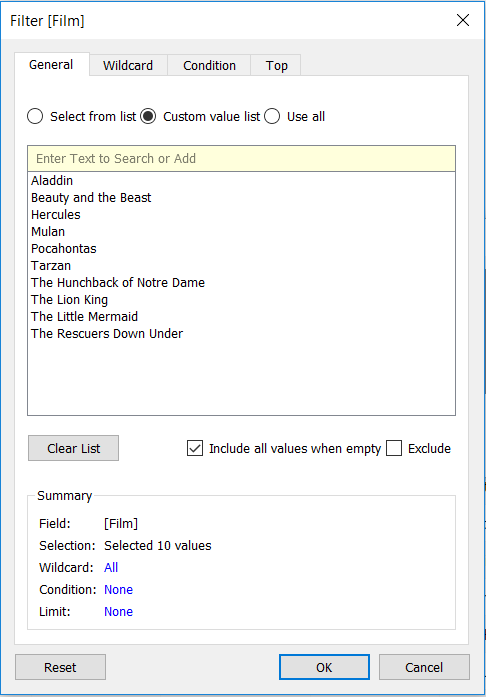
List films in the Disney Renaissance
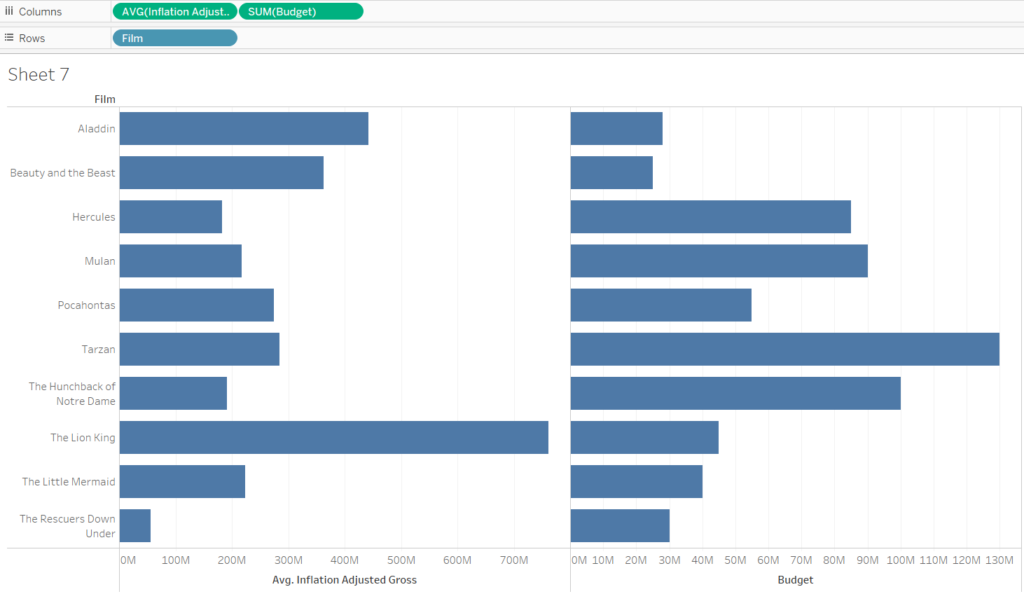
- Drag the average Inflated Adjusted Gross and the sum of Budget into the Columns shelf, and Film into Rows shelf.
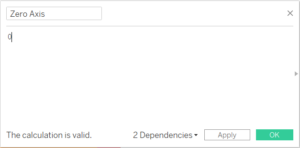
- Create a Calculated Field, labelling it ‘Zero Axis’ and type in 0 in the calculation pane.
- Drag the green Zero Axis pill in between the Inflated Adjusted Gross and Budget pill in the Columns shelf.
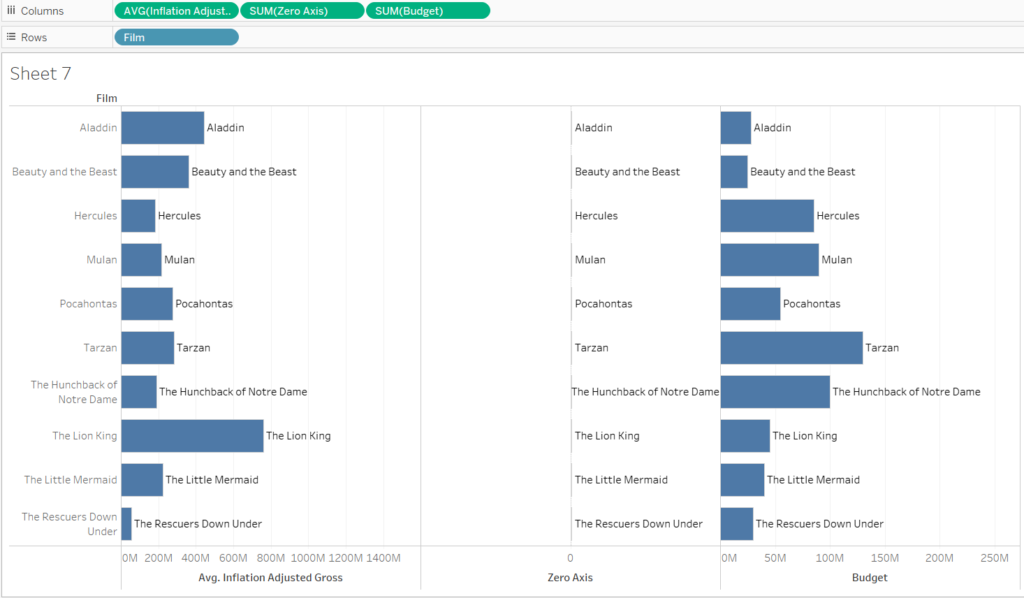
Zero Axis pill dragged into Columns shelf
- In the Zero Axis Marks card, drag the Film pill into Text.
- Uncheck the Show Header for Film in the chart.
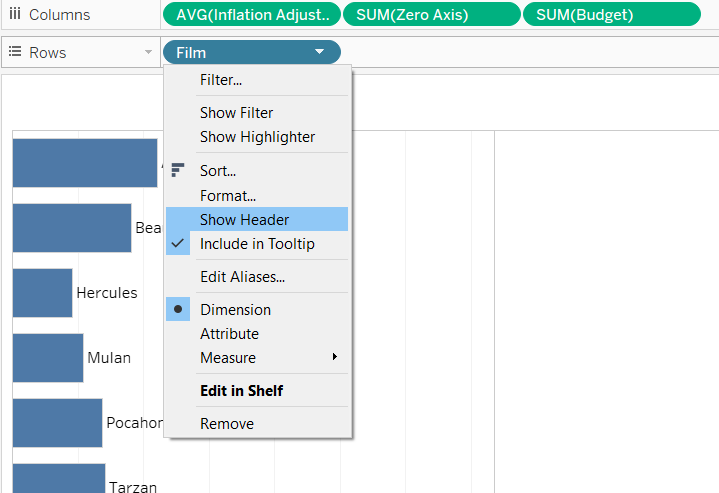
Uncheck ‘Show Header’
- In the Zero Axis Marks card, change Automatic to Text.
- Remove Film pill in the Marks card of both Individual Adjusted Gross and Budget.
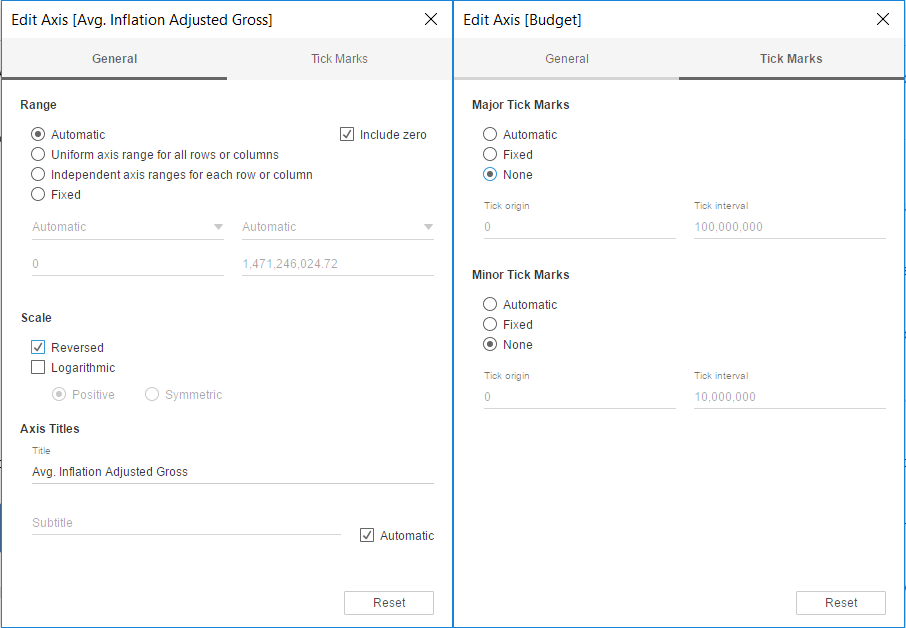
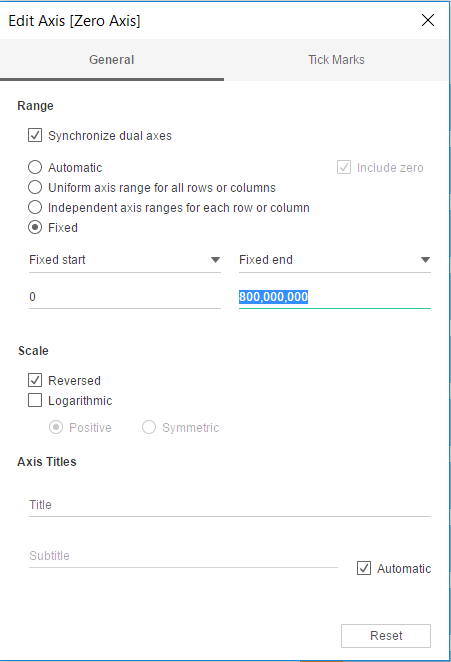
- Edit the Inflated Adjusted Gross axis (using Edit Axis) and tick Reverse. Edit both Individual Adjusted Gross, Budget and Zero Axis axes to have no tick marks. Also, remove Zero Axis title.
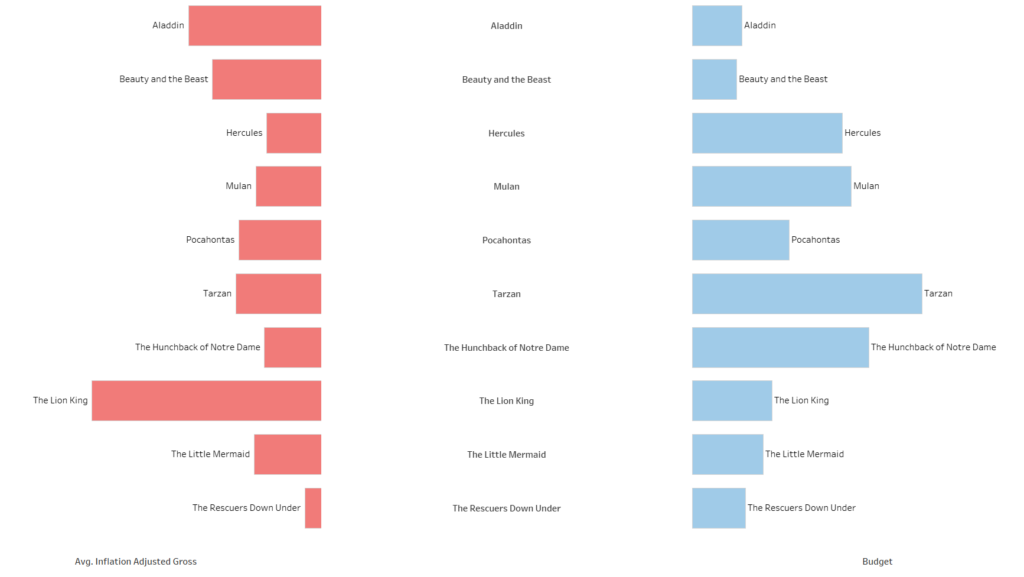
- As visual aid, change colour of bars for both Inflated Adjusted Gross and Budget to help distinguish between the two. Also, remove all grid lines.
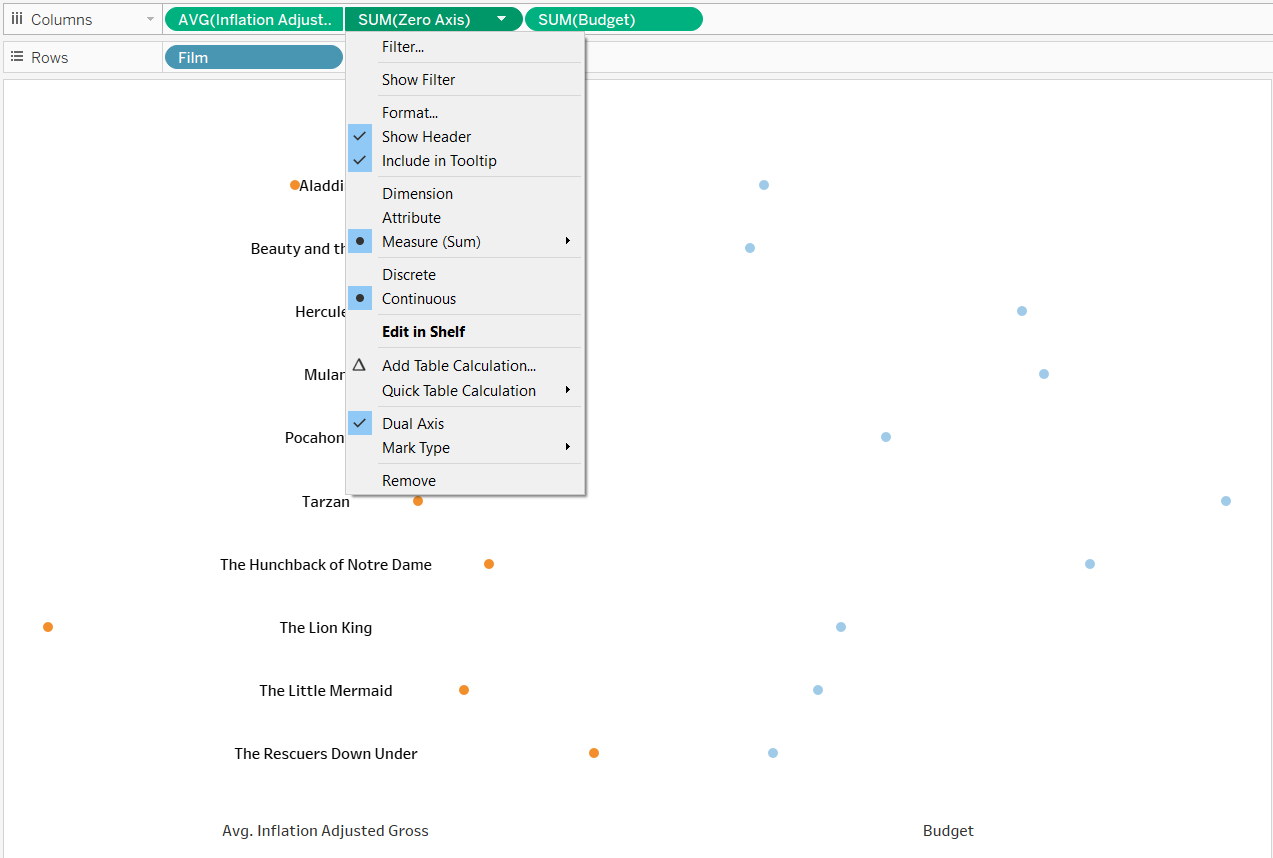
- On the drop-down arrow on the Zero Axis pill in the Columns shelf, click on Dual Axis. Do not worry, your work will at first look a bit bizarre.
- In the Marks card for both Inflated Adjusted Gross and Budget, change Automatic to Bar in drop-down menu.
- Synchronise the Inflated Adjusted Gross axis and in Edit Axis, make the Fixed Start 0 and Fixed End 800,000,000. The reason for this will become apparent later.
- Drag another Zero Axis pill from Measures into the Columns shelf next to the Budget pill and make the Zero Axis a dual axis like in step 10.
- On the right-hand Zero Axis axis, synchronise the axis. Also, make the Fixed Start 0 and the Fixed End 800,000,000 just as before for the left-hand Zero Axis axis. This was done to make Inflated Adjusted Gross and Budget to be fairly relative to each other. Then hide the Zero Axis headers.
- In the second Zero Axis Marks card, change Automatic to Text.
- Drag the Film pill into Text in the second Zero Axis Marks card.
- Finally, edit the tooltips to your liking.
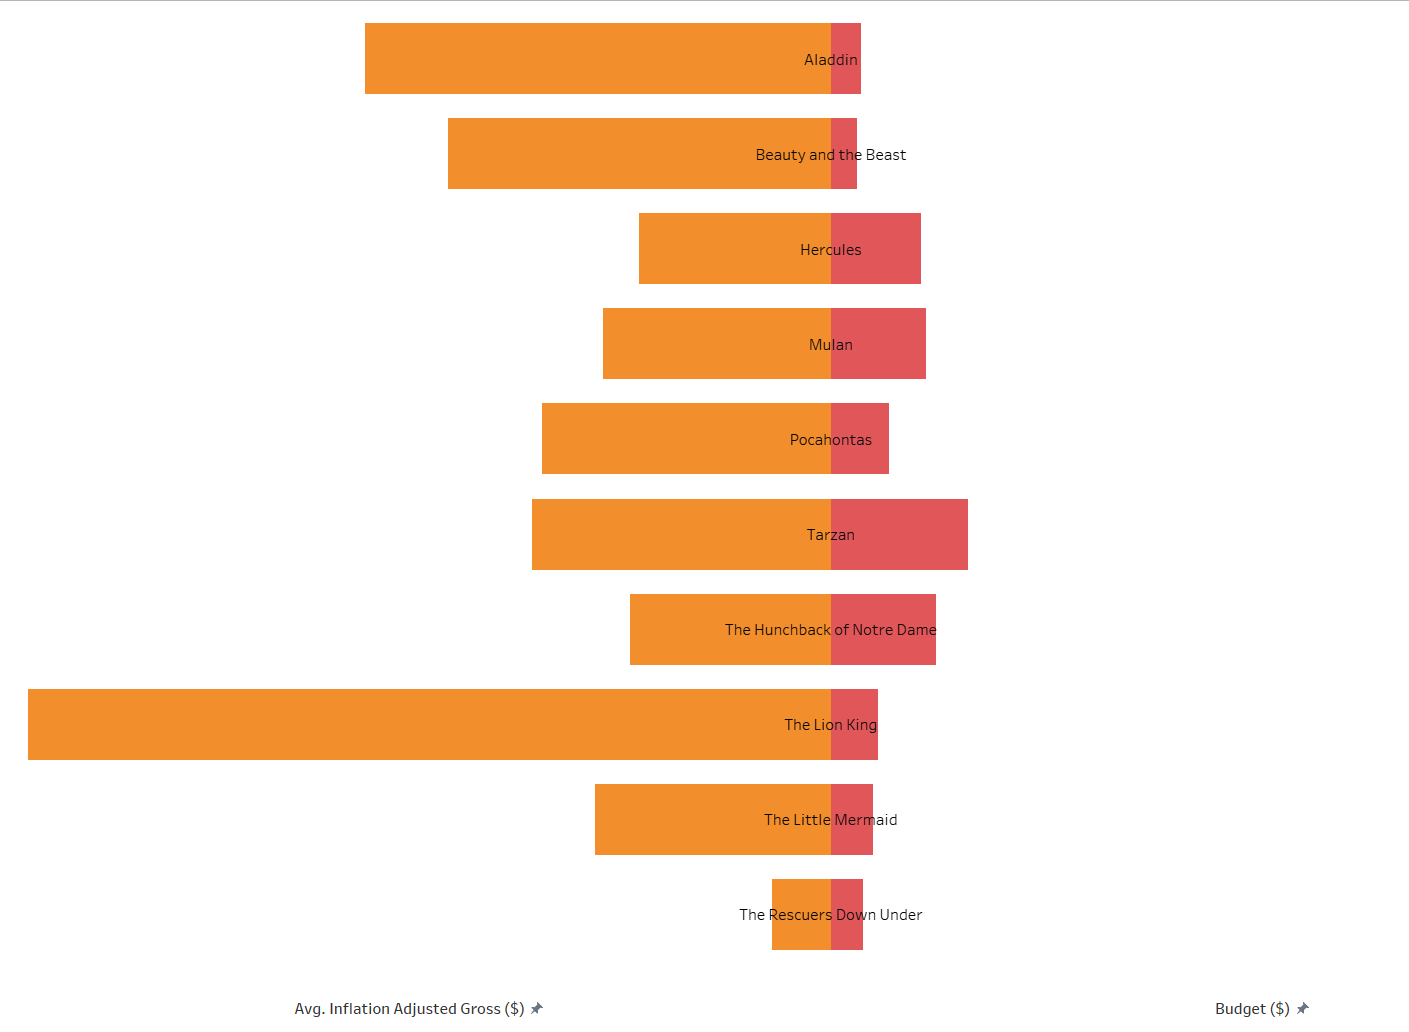
Butterfly Chart
