My Tableau Tutorials series of blogs is going to focus on how to build different chart types in Tableau. If you would like any additional help, or have a chart type you’d like me to blog about contact me via twitter @McVizzies.
Building a Jitter Plot
You can complete most of a jitter plot by building a Strip Plot. If you need a hand getting to this point, my last tutorial shows you how do to just that and you can find it here.
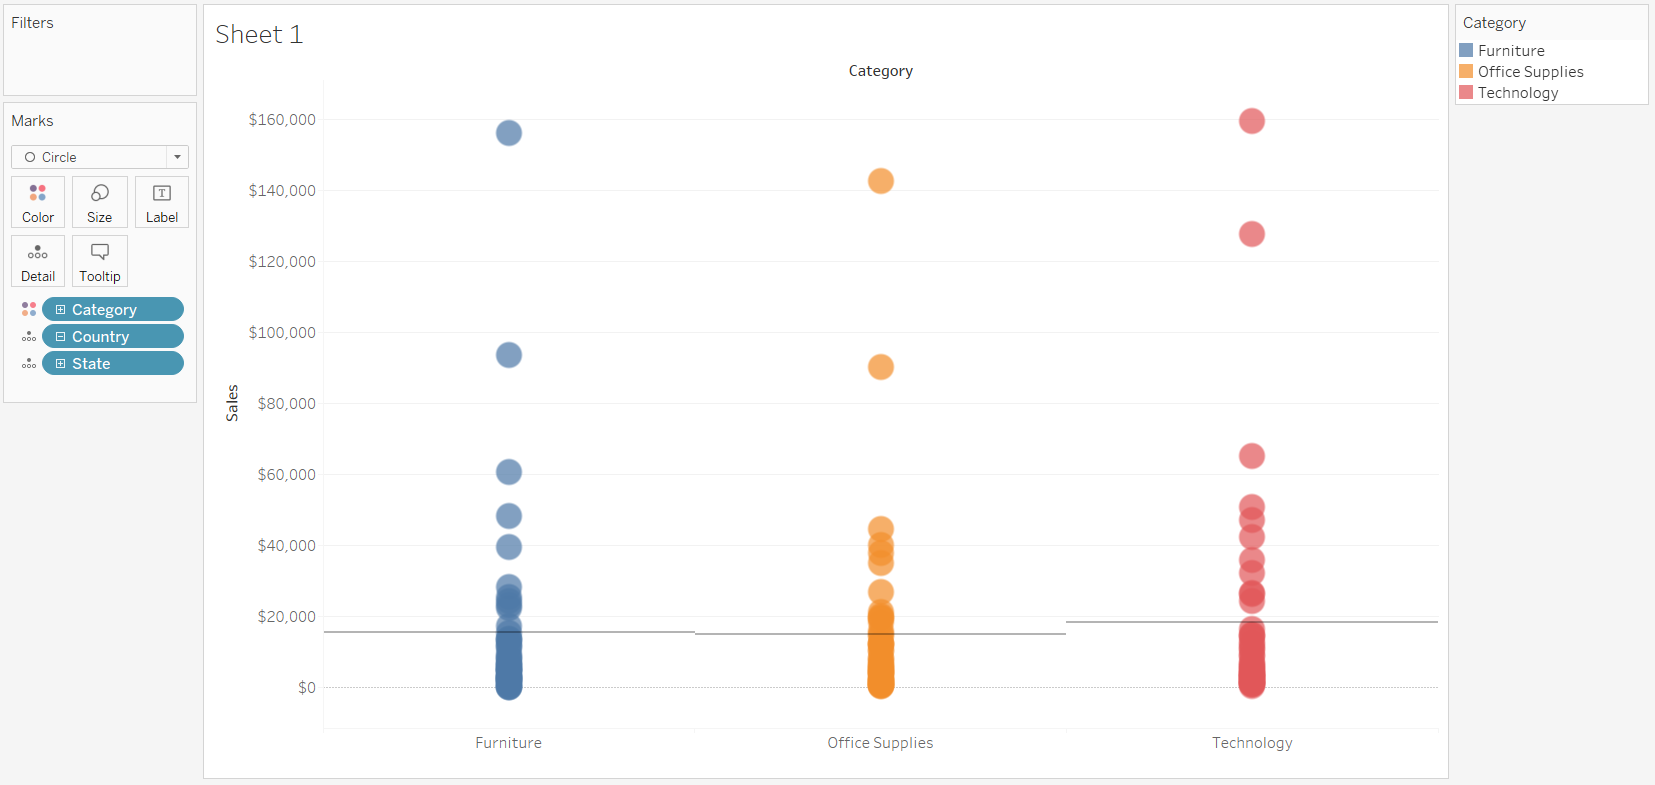
If you followed my strip plot blog you should now be at this point
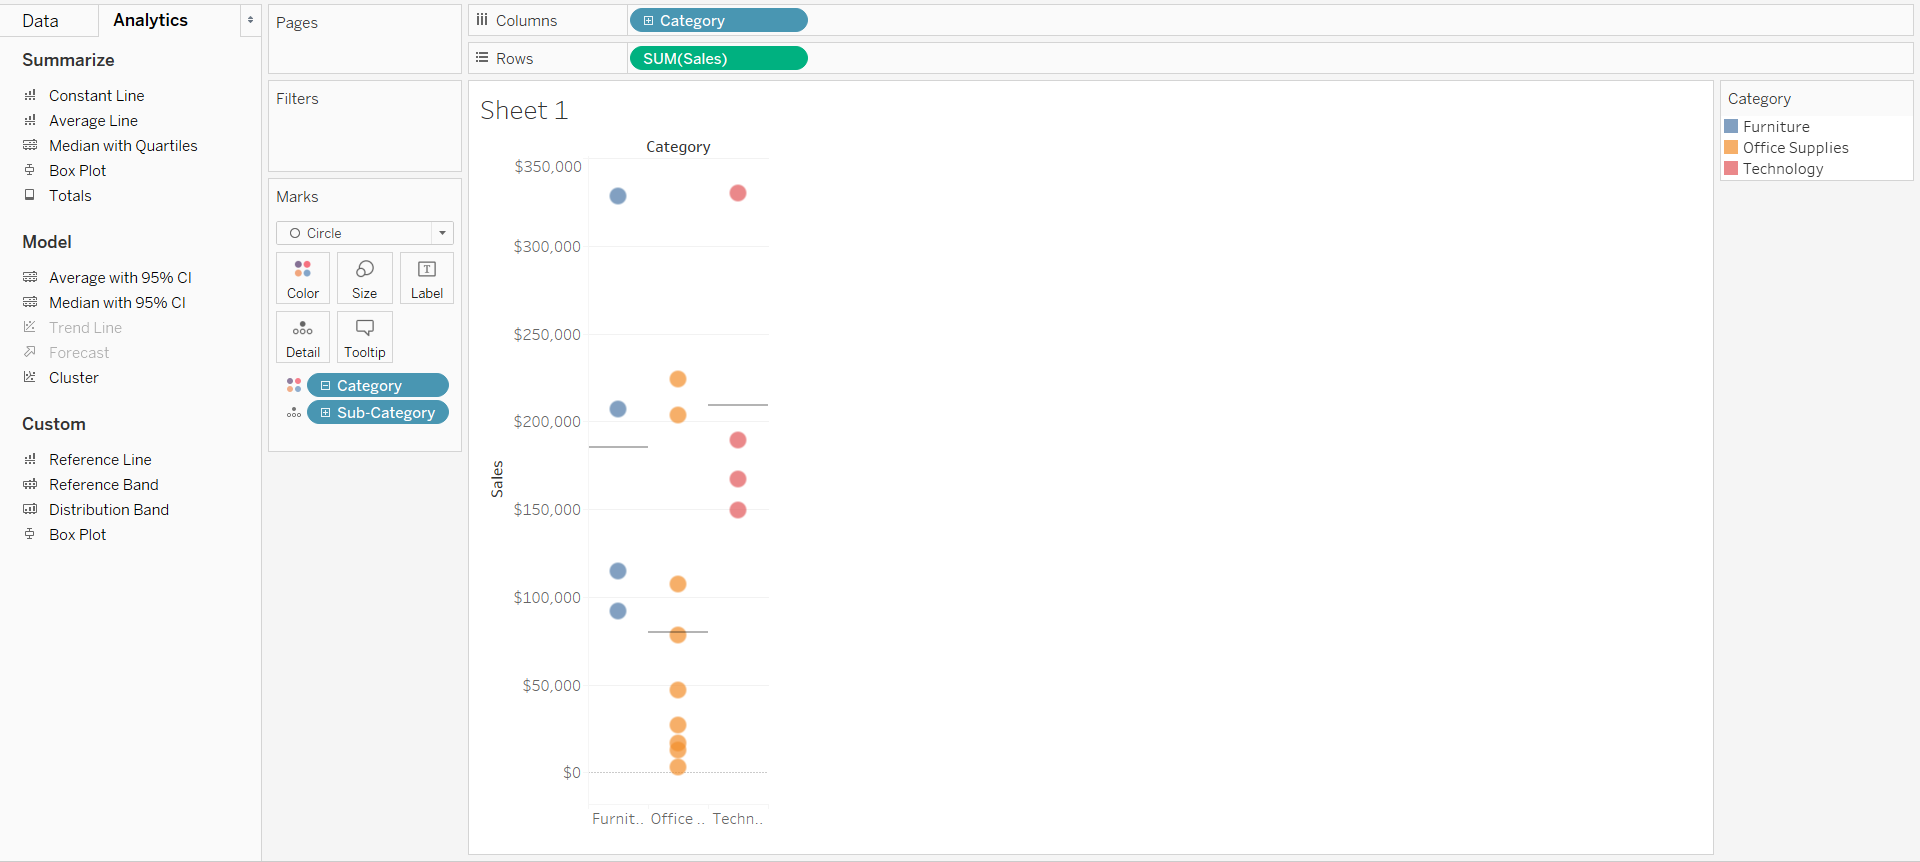
The main reason to use a jitter plot rather than a strip plot is when you have too many marks overlapping and either you want to be able to select any individual mark (which is difficult or even impossible if the marks overlap entirely). So for this tutorial I have changed the dimension on detail in increase the number. I’ve also made it show the entire view.
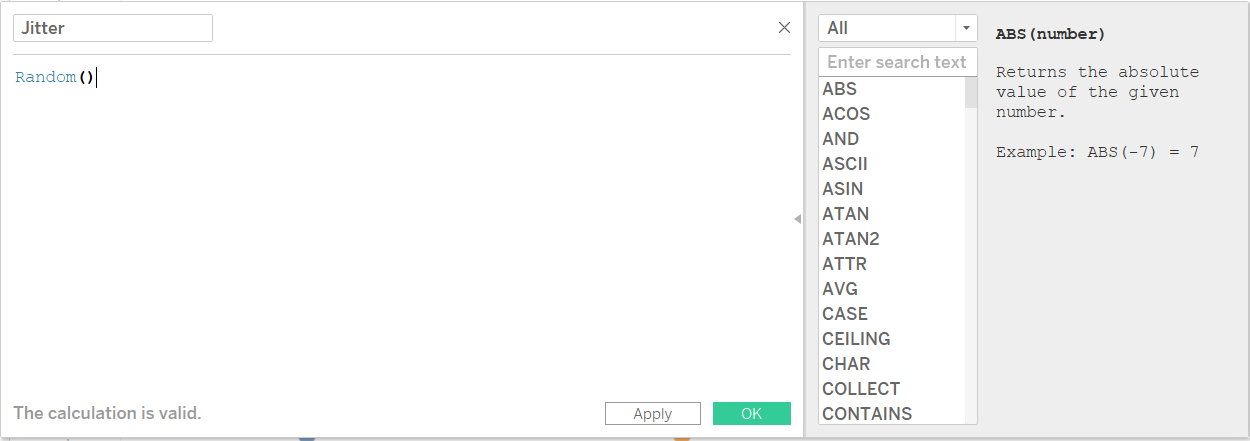
The next step is to create a new field, and type Random(). This is a hidden field in Tableau which assigns a random number between 0 and 1 to each row.
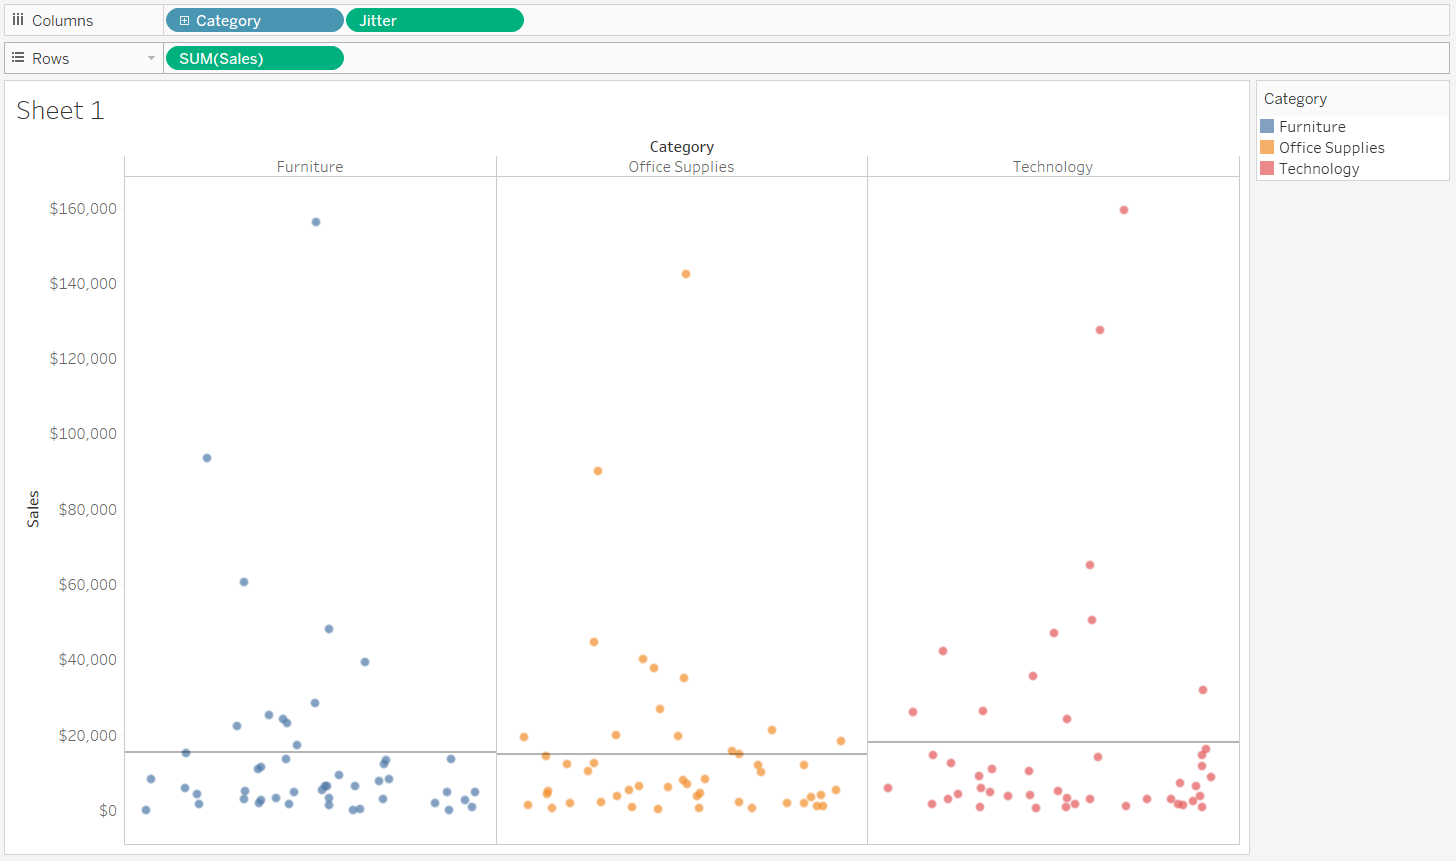
Place this new field onto columns as a dimension. If jitter is aggregated, i.e. sum(jitter) you just need to right click the pill, and make it a dimension. Then tidy the formatting and remove the jitter axis from view.