If you’ve used Tableau even a little you may at some point have been met with an asterisk where your expecting a value. From what I’ve experienced, the most common cause of this is when using the ATTR() function. So, what is going on? First lets understand what the ATTR() function is and what its used for.
What is the ATTR() function?
The ATTR() (Attribute) function is an aggregation function useful for text fields. Very simply, if there is only a single value for that field at the relevant level of detail, the aggregated field will return that single value when the ATTR() function is applied. If there is more than one value, an asterisk is returned as Tableau doesn’t know how to handle the ambiguity of there being more than a single value in the field at the relevant level of detail.
Lets see an example of this in action:
I’ve been keeping track of my runs and have ended up with the below data set which counts the number of jogs I’ve been for per month and where the jog was undertaken. I work and live in London so most of my jogs take place in London, however, I went home to Newcastle for Christmas where I has 15 jogs.
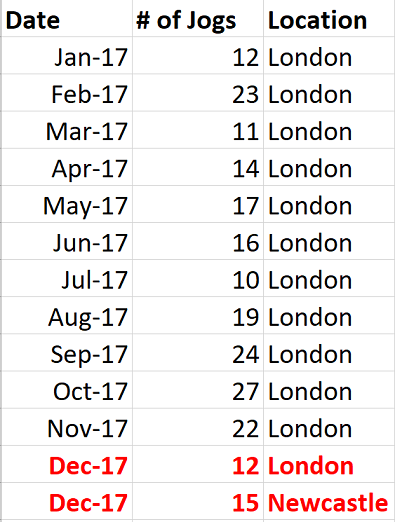
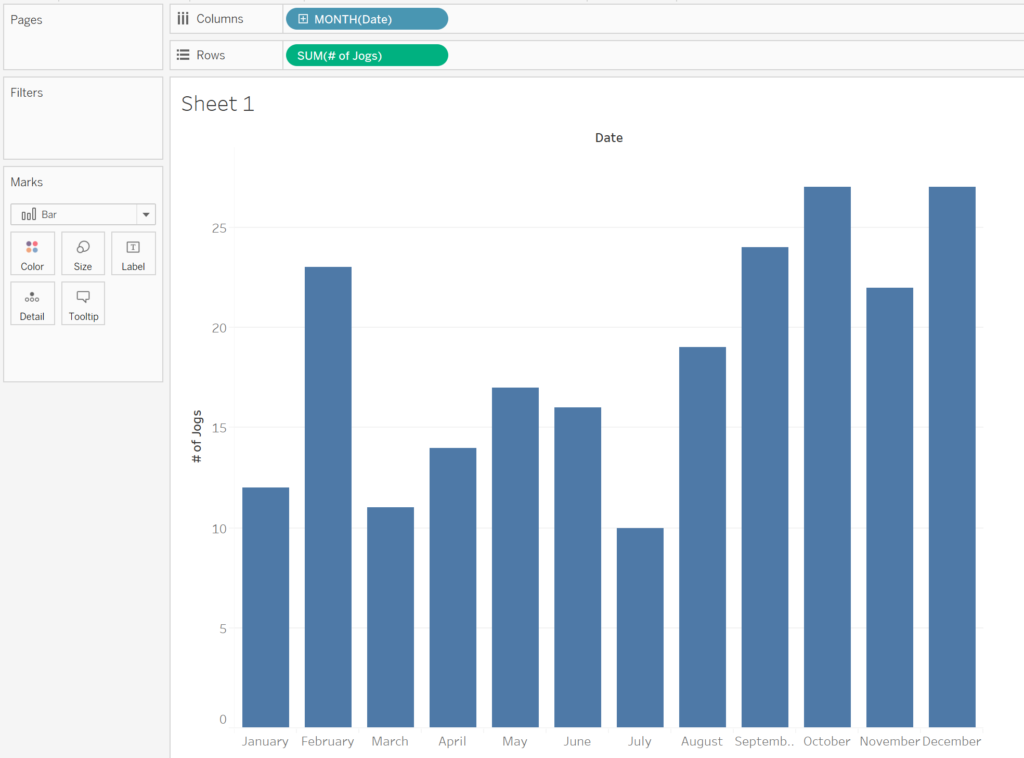
NOTICE: December has two rows of data because the jogs were undertaken in two different cities. Lets make a bar chart in Tableau and force some asterisks!:
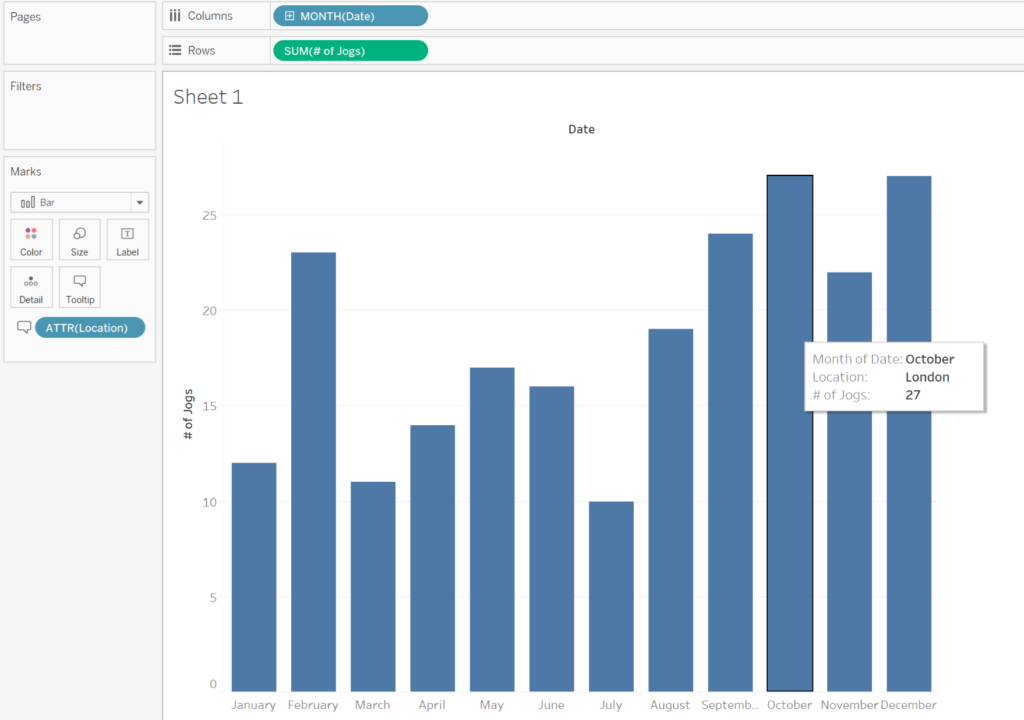
To better understand whats happening here, It helps to think of what the ATTR() function is actually doing to the [Location] field. Some version of the following logic is applied.
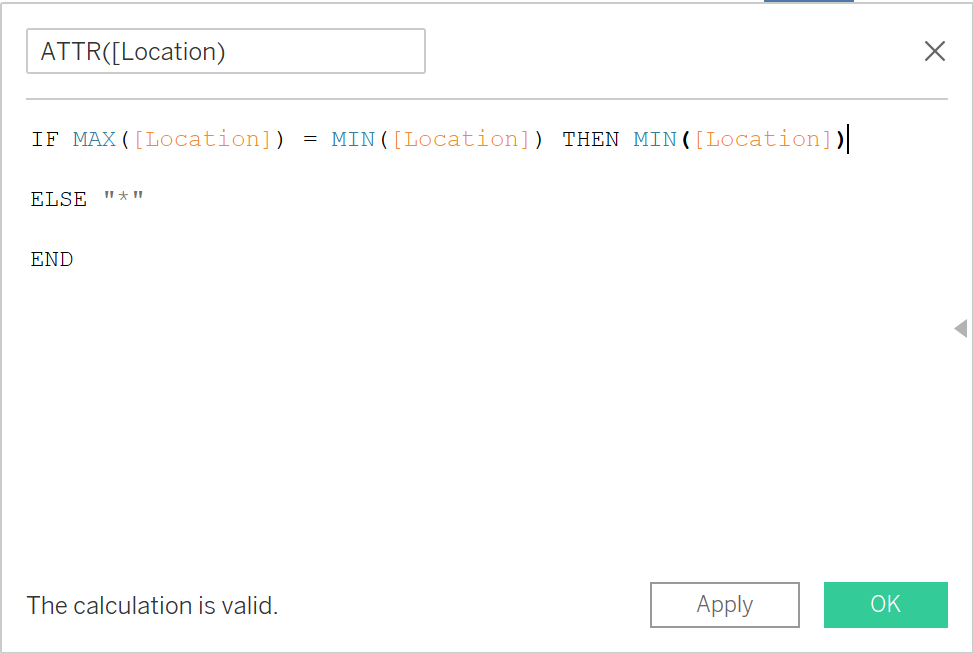
In every case, if MIN(Field) != (MAX[Field]) you will see an asterisk.
Asterisks When Blending Data in Tableau
Asterisks can appear in your view when blending data for the same reason as described above. If two data sources are blended and there are multiple matching values as a result, then the ambiguity will force Tableau to display asterisks.
Consider blending data source 1: (states + state codes) and data source 2: US superstore. These two data sets are blended on [State]
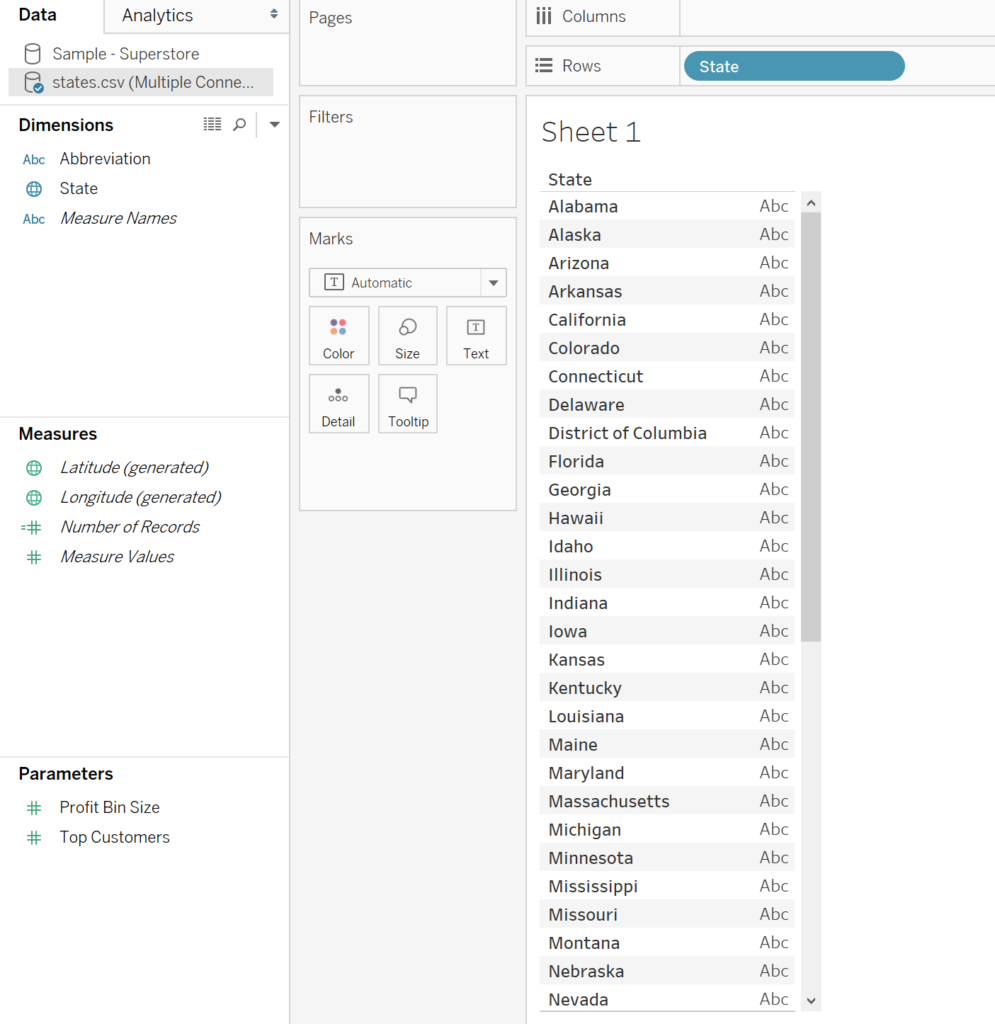
Data Source 1 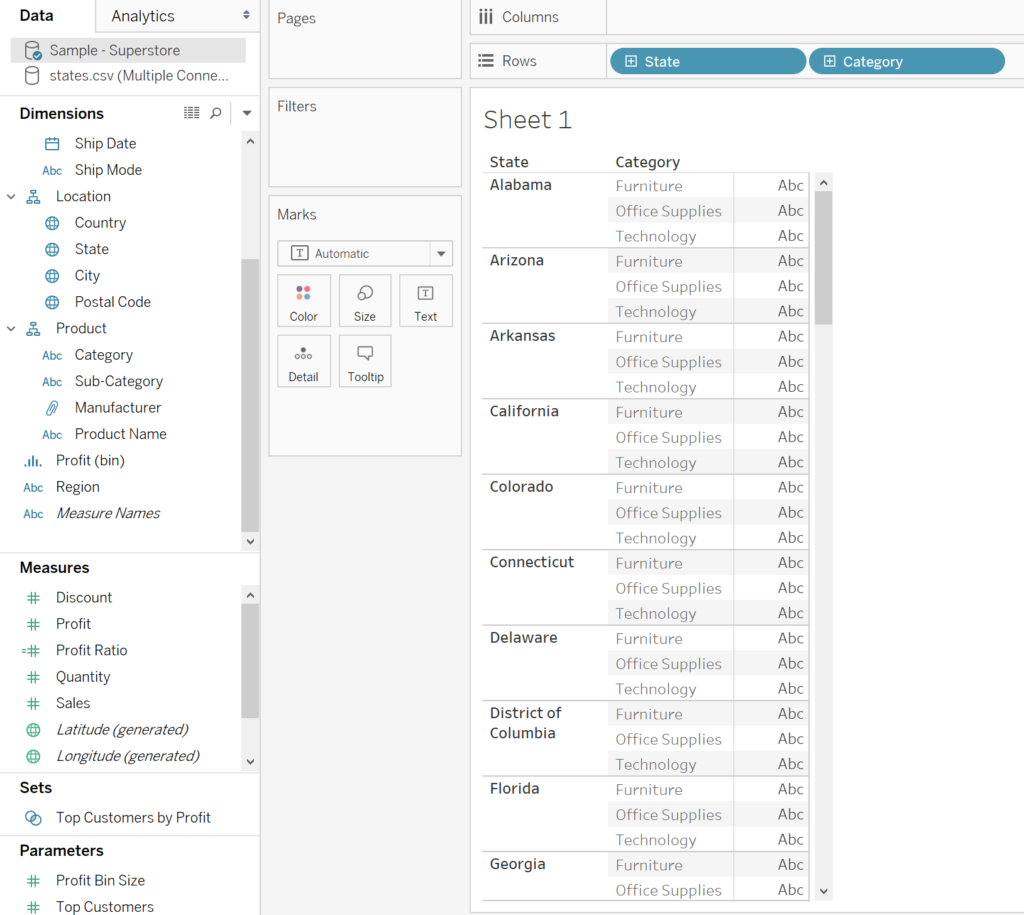
Data Source 2
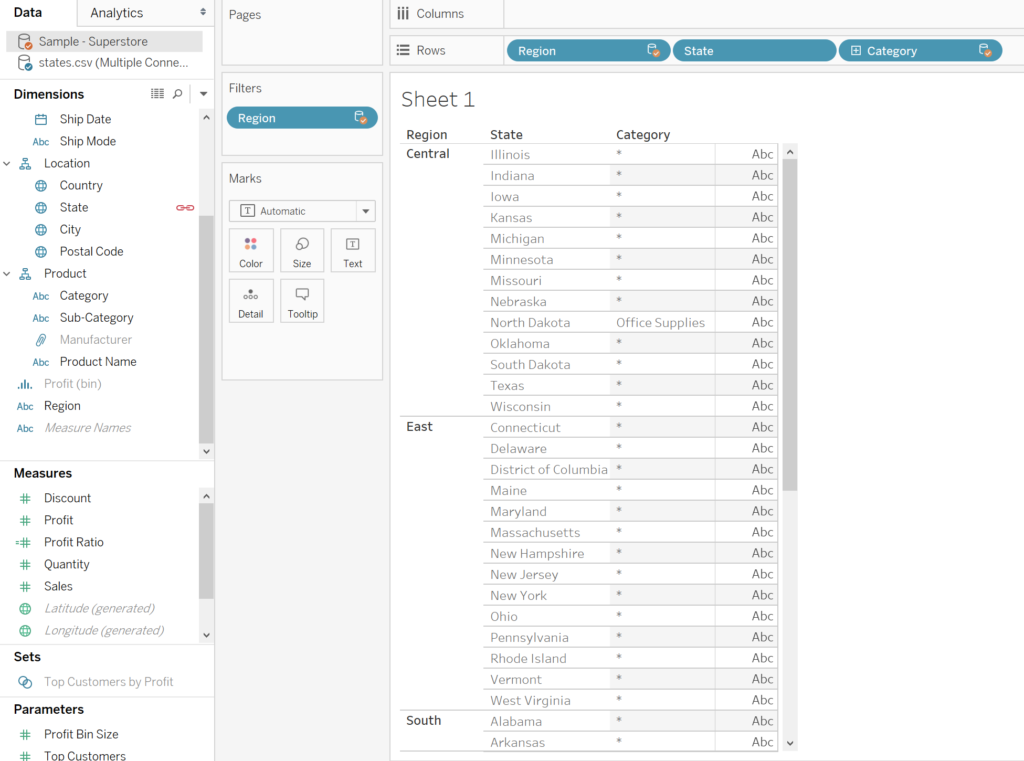
When we blend two data sources on [State] we create a situation where States have a single category in data source 1, but more than 1 on account of adding data source 2. We therefore see a star where category should. Tableau cannot process the ambiguity!
Hope this has cleared up why we see pesky asterisks. I will be keeping a look out for other causes of this and will update this blog accordingly.
Further Reading
Check out this great blog by Joe Macari: