More tips for how to start thinking about creating a viz without even touching a computer. Here’s how to get going when you’re not sure where to start!
Quick Ideas, Quick Thinking, Quick Sketching
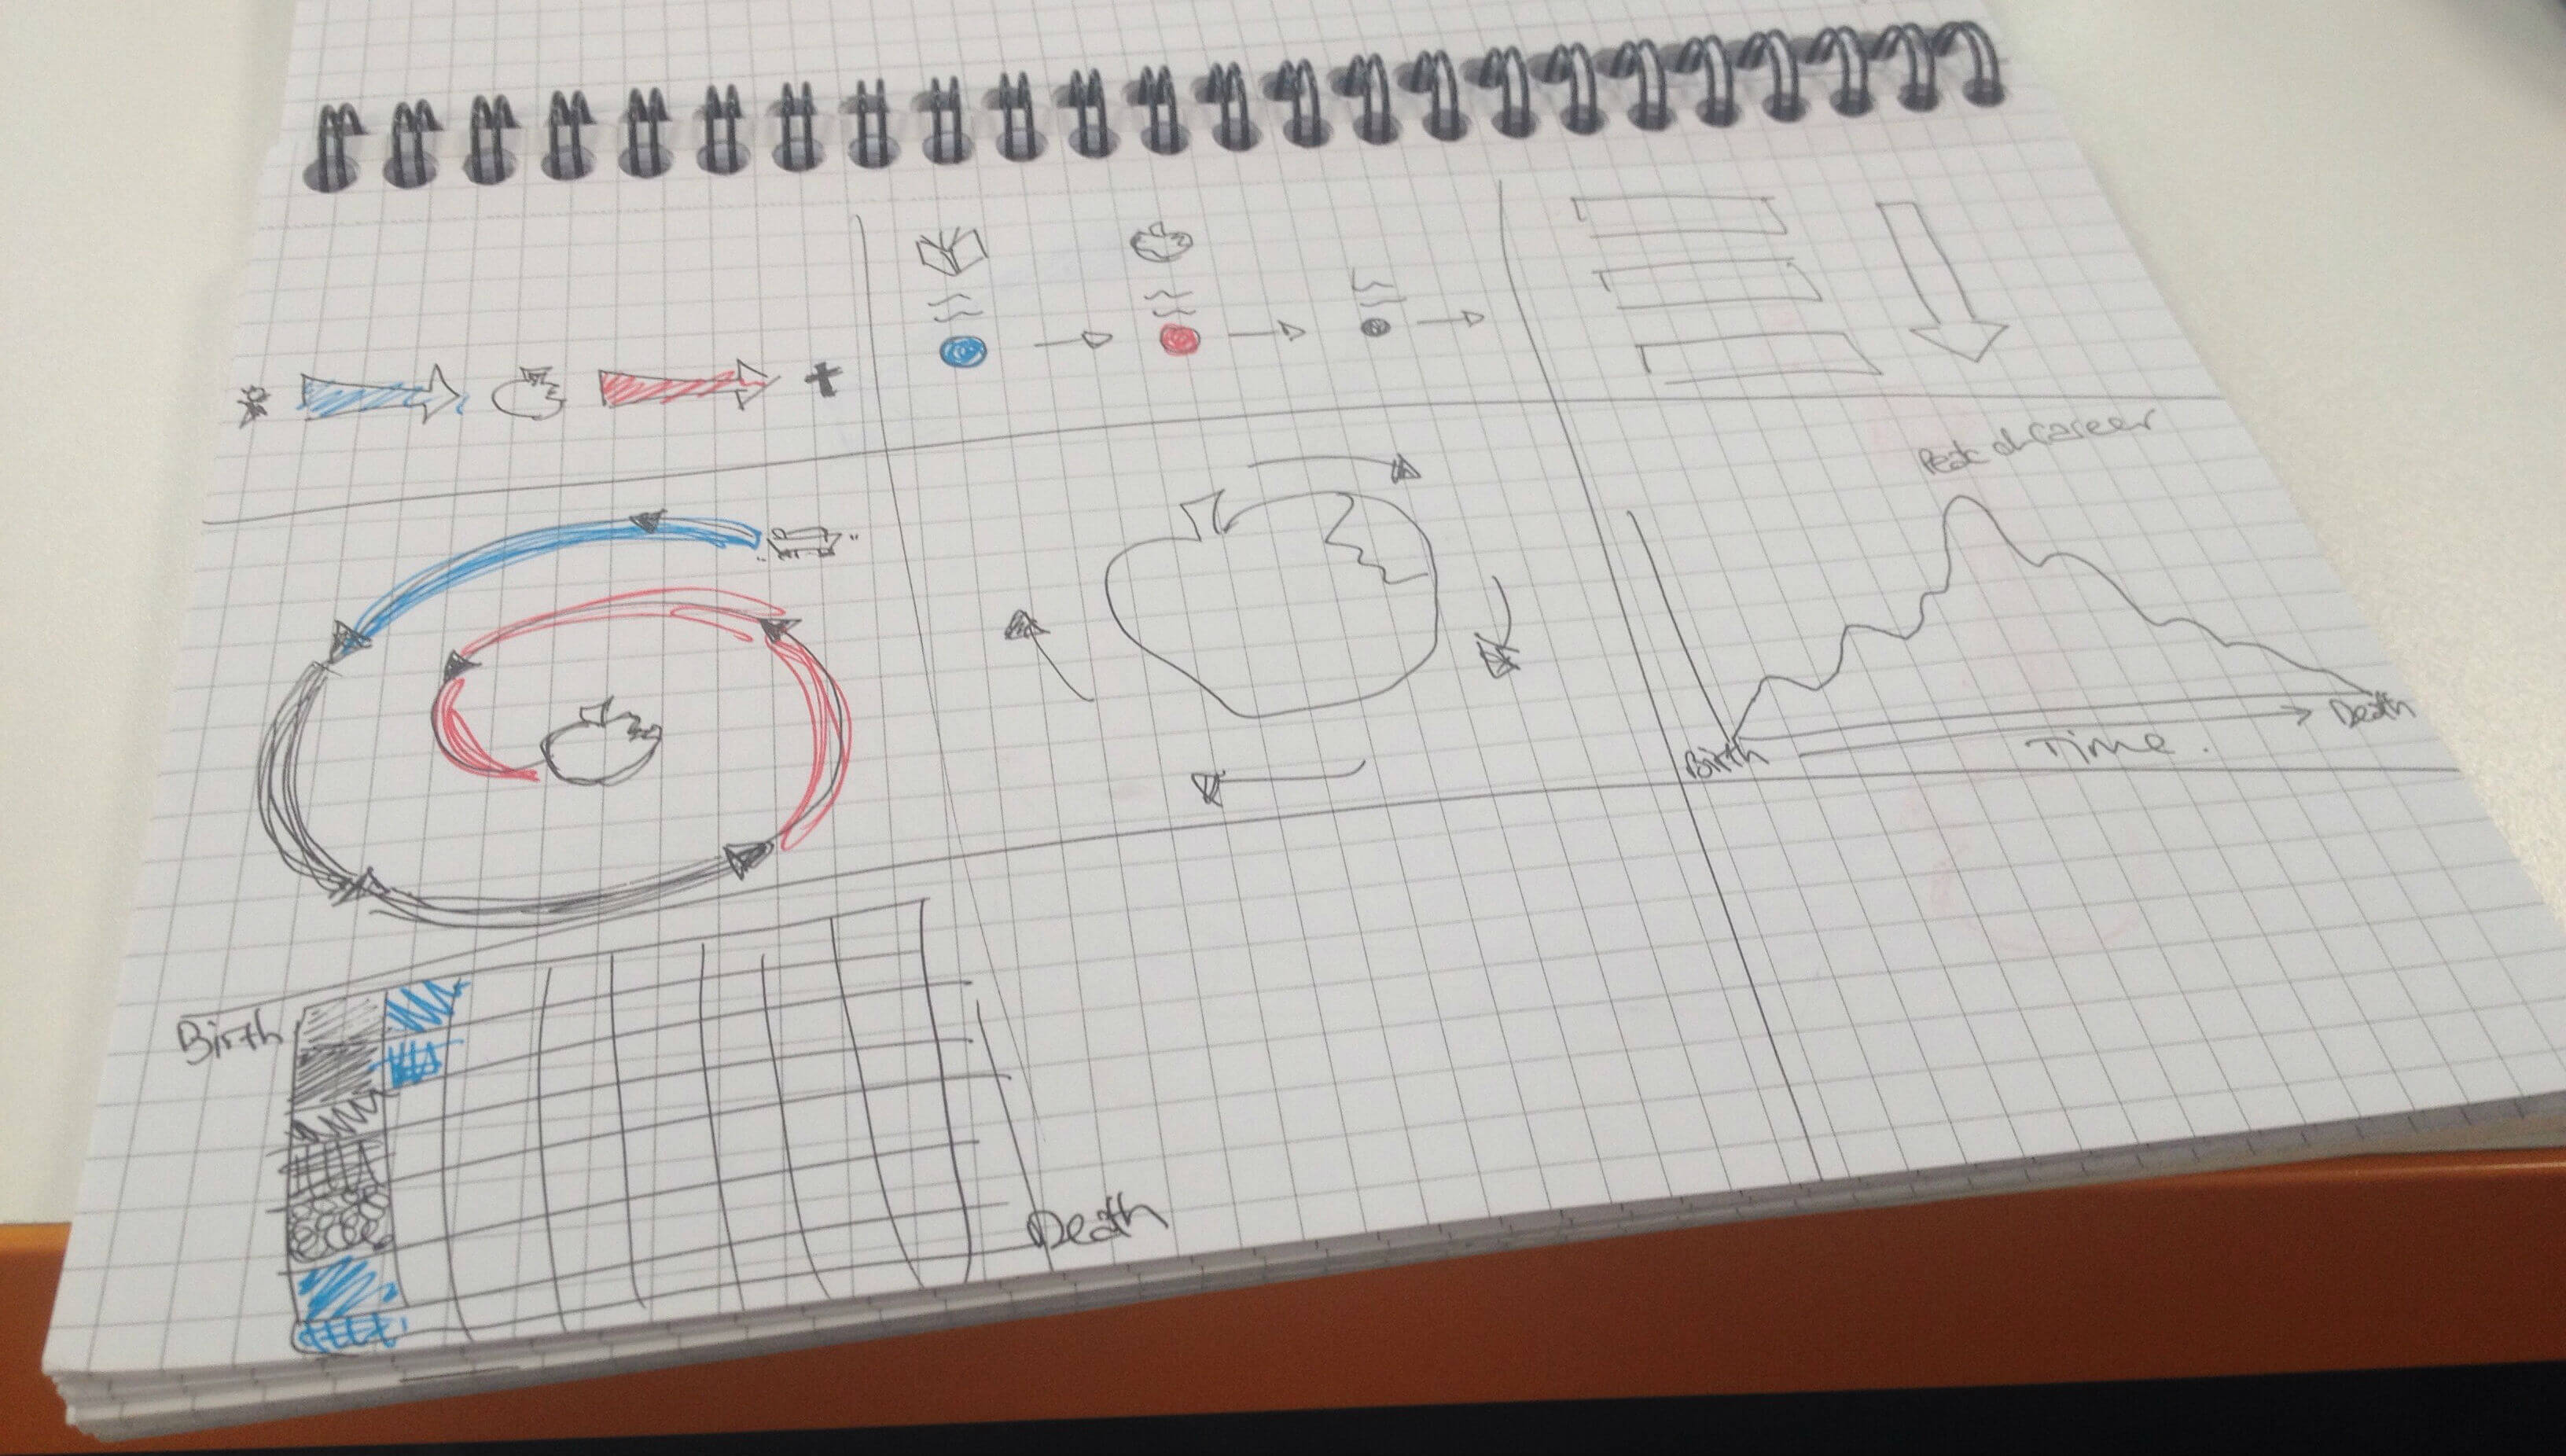 Get as many ideas down on paper as quickly as possible. Try drawing a noughts and crosses type grid (or Tic-Tac-Toe for our American cousins) and then scrawling out as many different viz possibilities as quickly you can. Don’t look too much at the data! This is such a powerful way of brainstorming and it frees you to think about the story you want to tell and stops you from going down the often inevitable rabbit hole that comes from that initial spark of ‘Ooooh, look at all this lovely data I’ve got my mitts on’. The pic on the left shows a few ideas of how you might think about visualising the life of Steve Jobs.
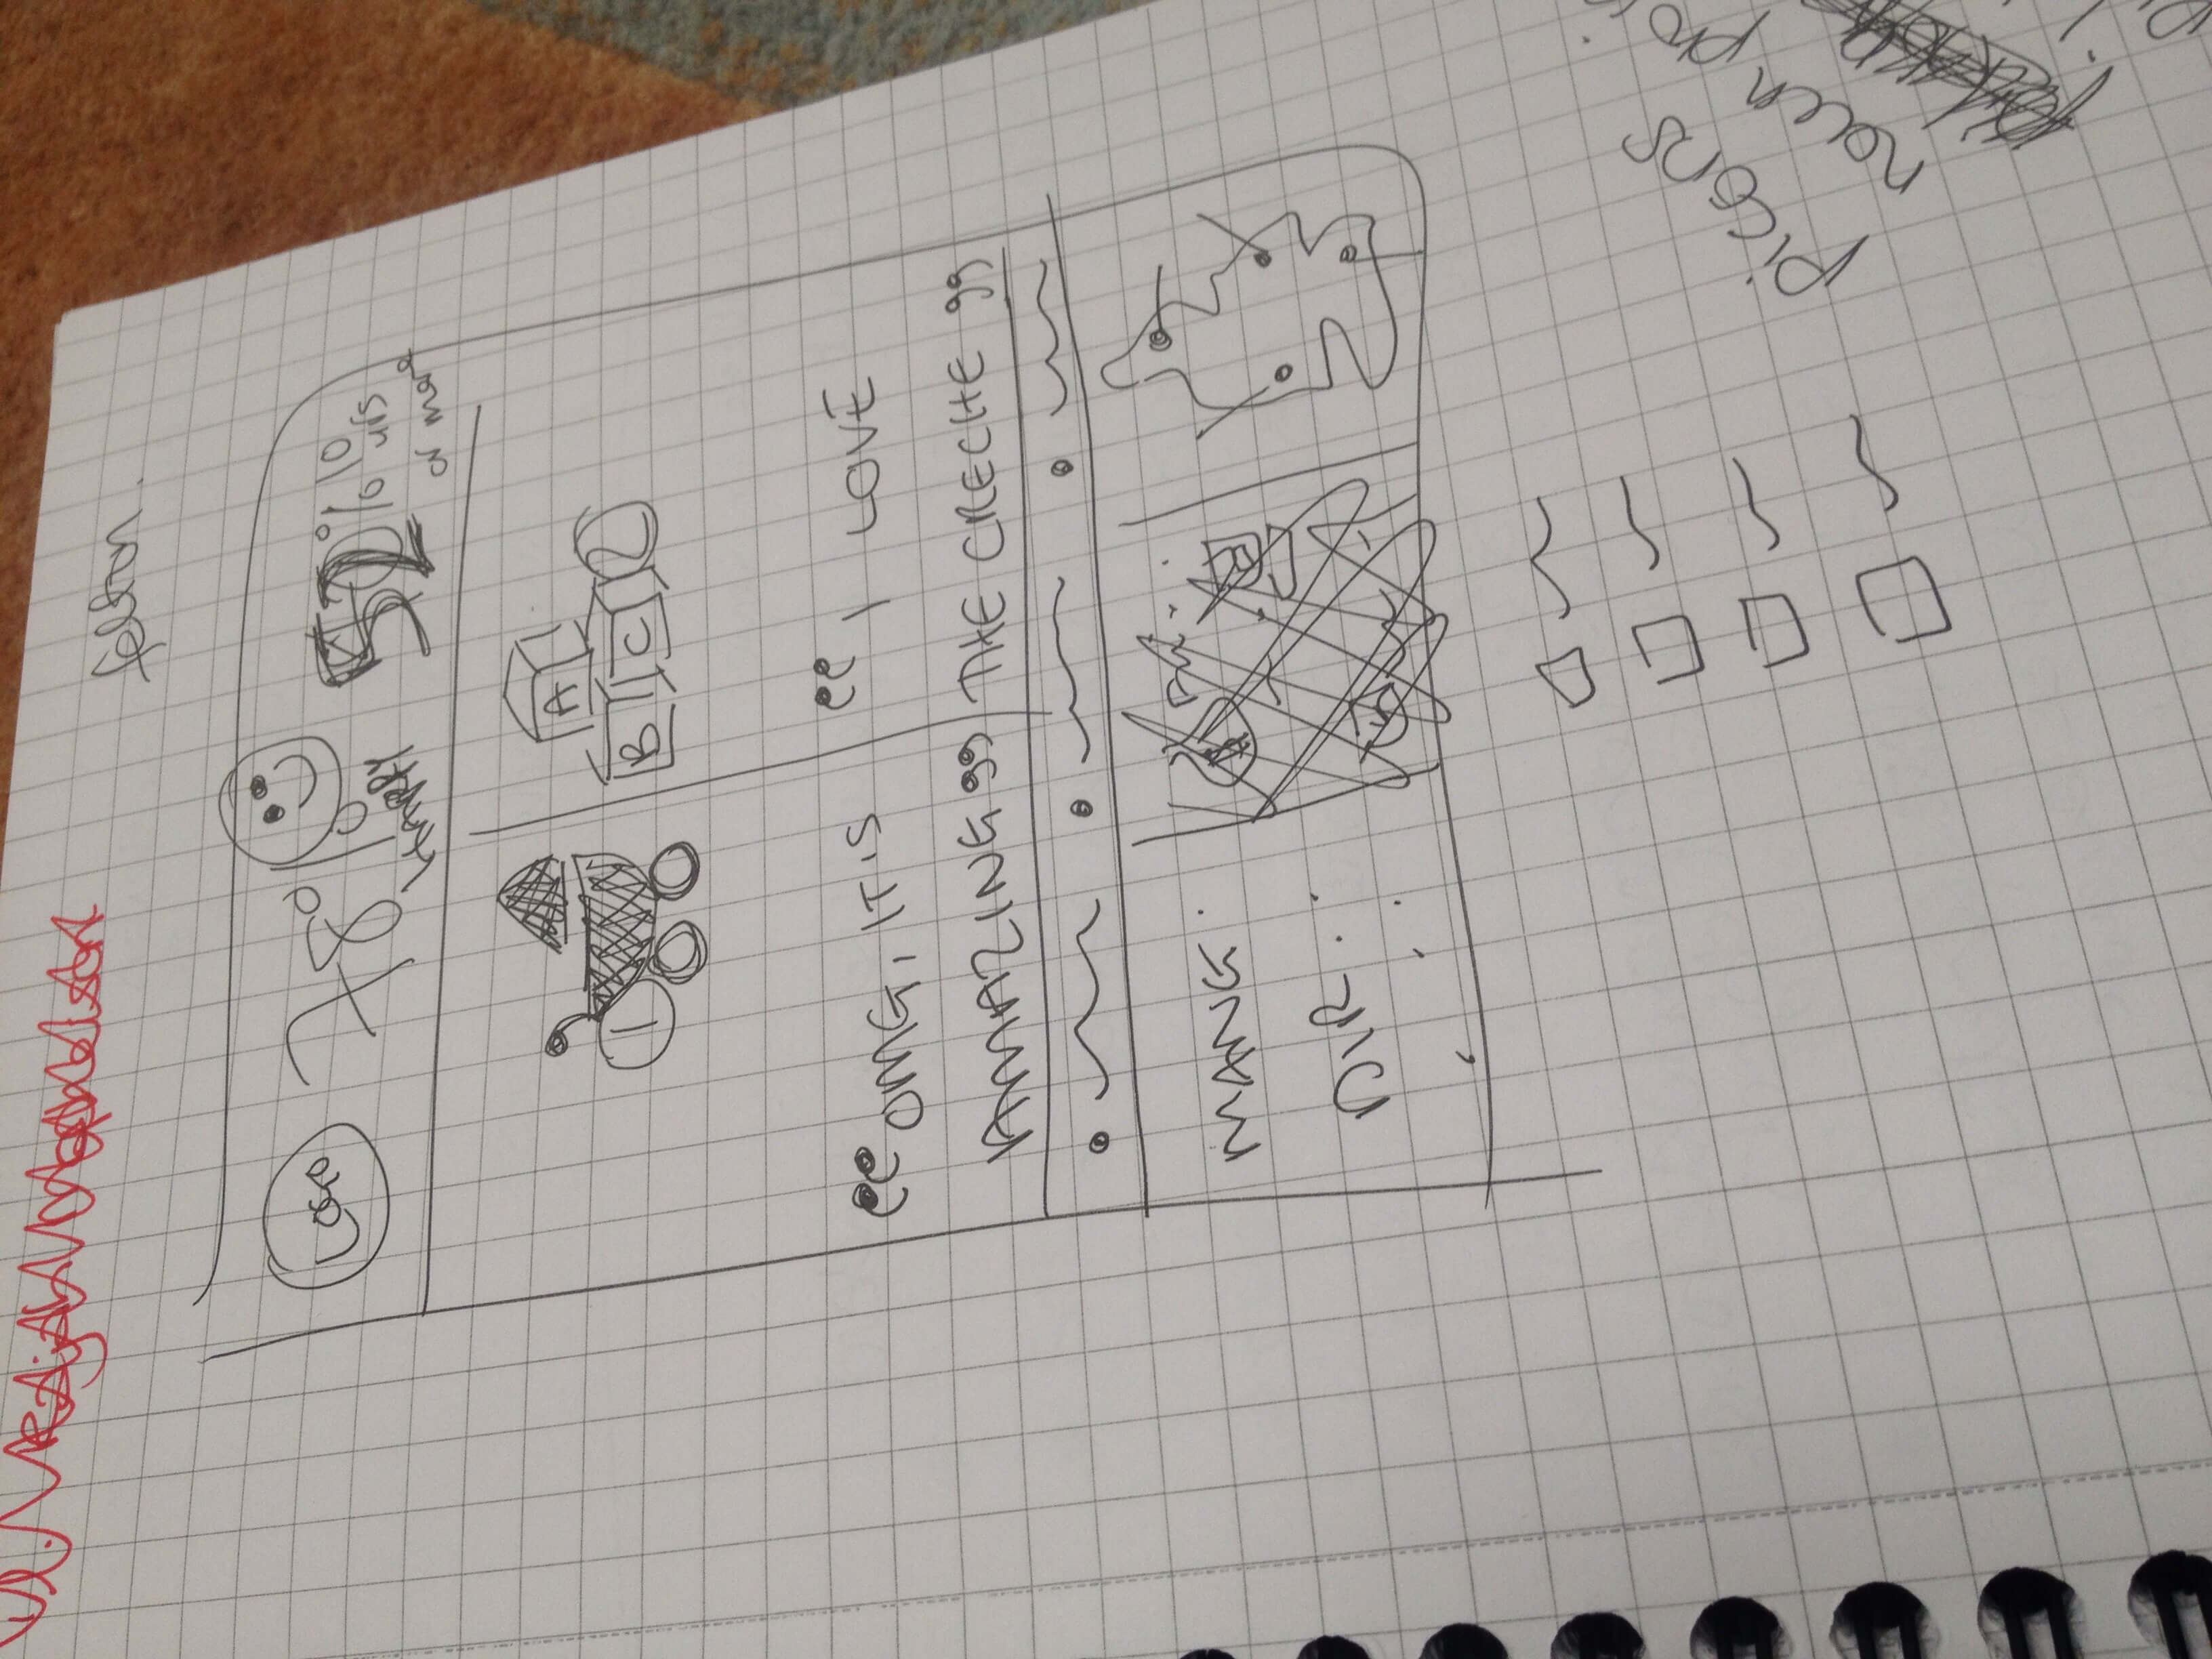 Next, pick one idea and riff on it. Think about how you want to lay out your viz or infographic. Sketch out a rough idea of where you might want things on the page. Scribble it out, don’t spend too much time. This will give you a really good framework to build your viz around, and will hopefully again stop you from trying to cram too much into it. Here’s the initial idea we came up with for a brief – we had to make a poster for a careers fair. A fictitious energy firm wanted to show how family friendly the company’s HR policies were.
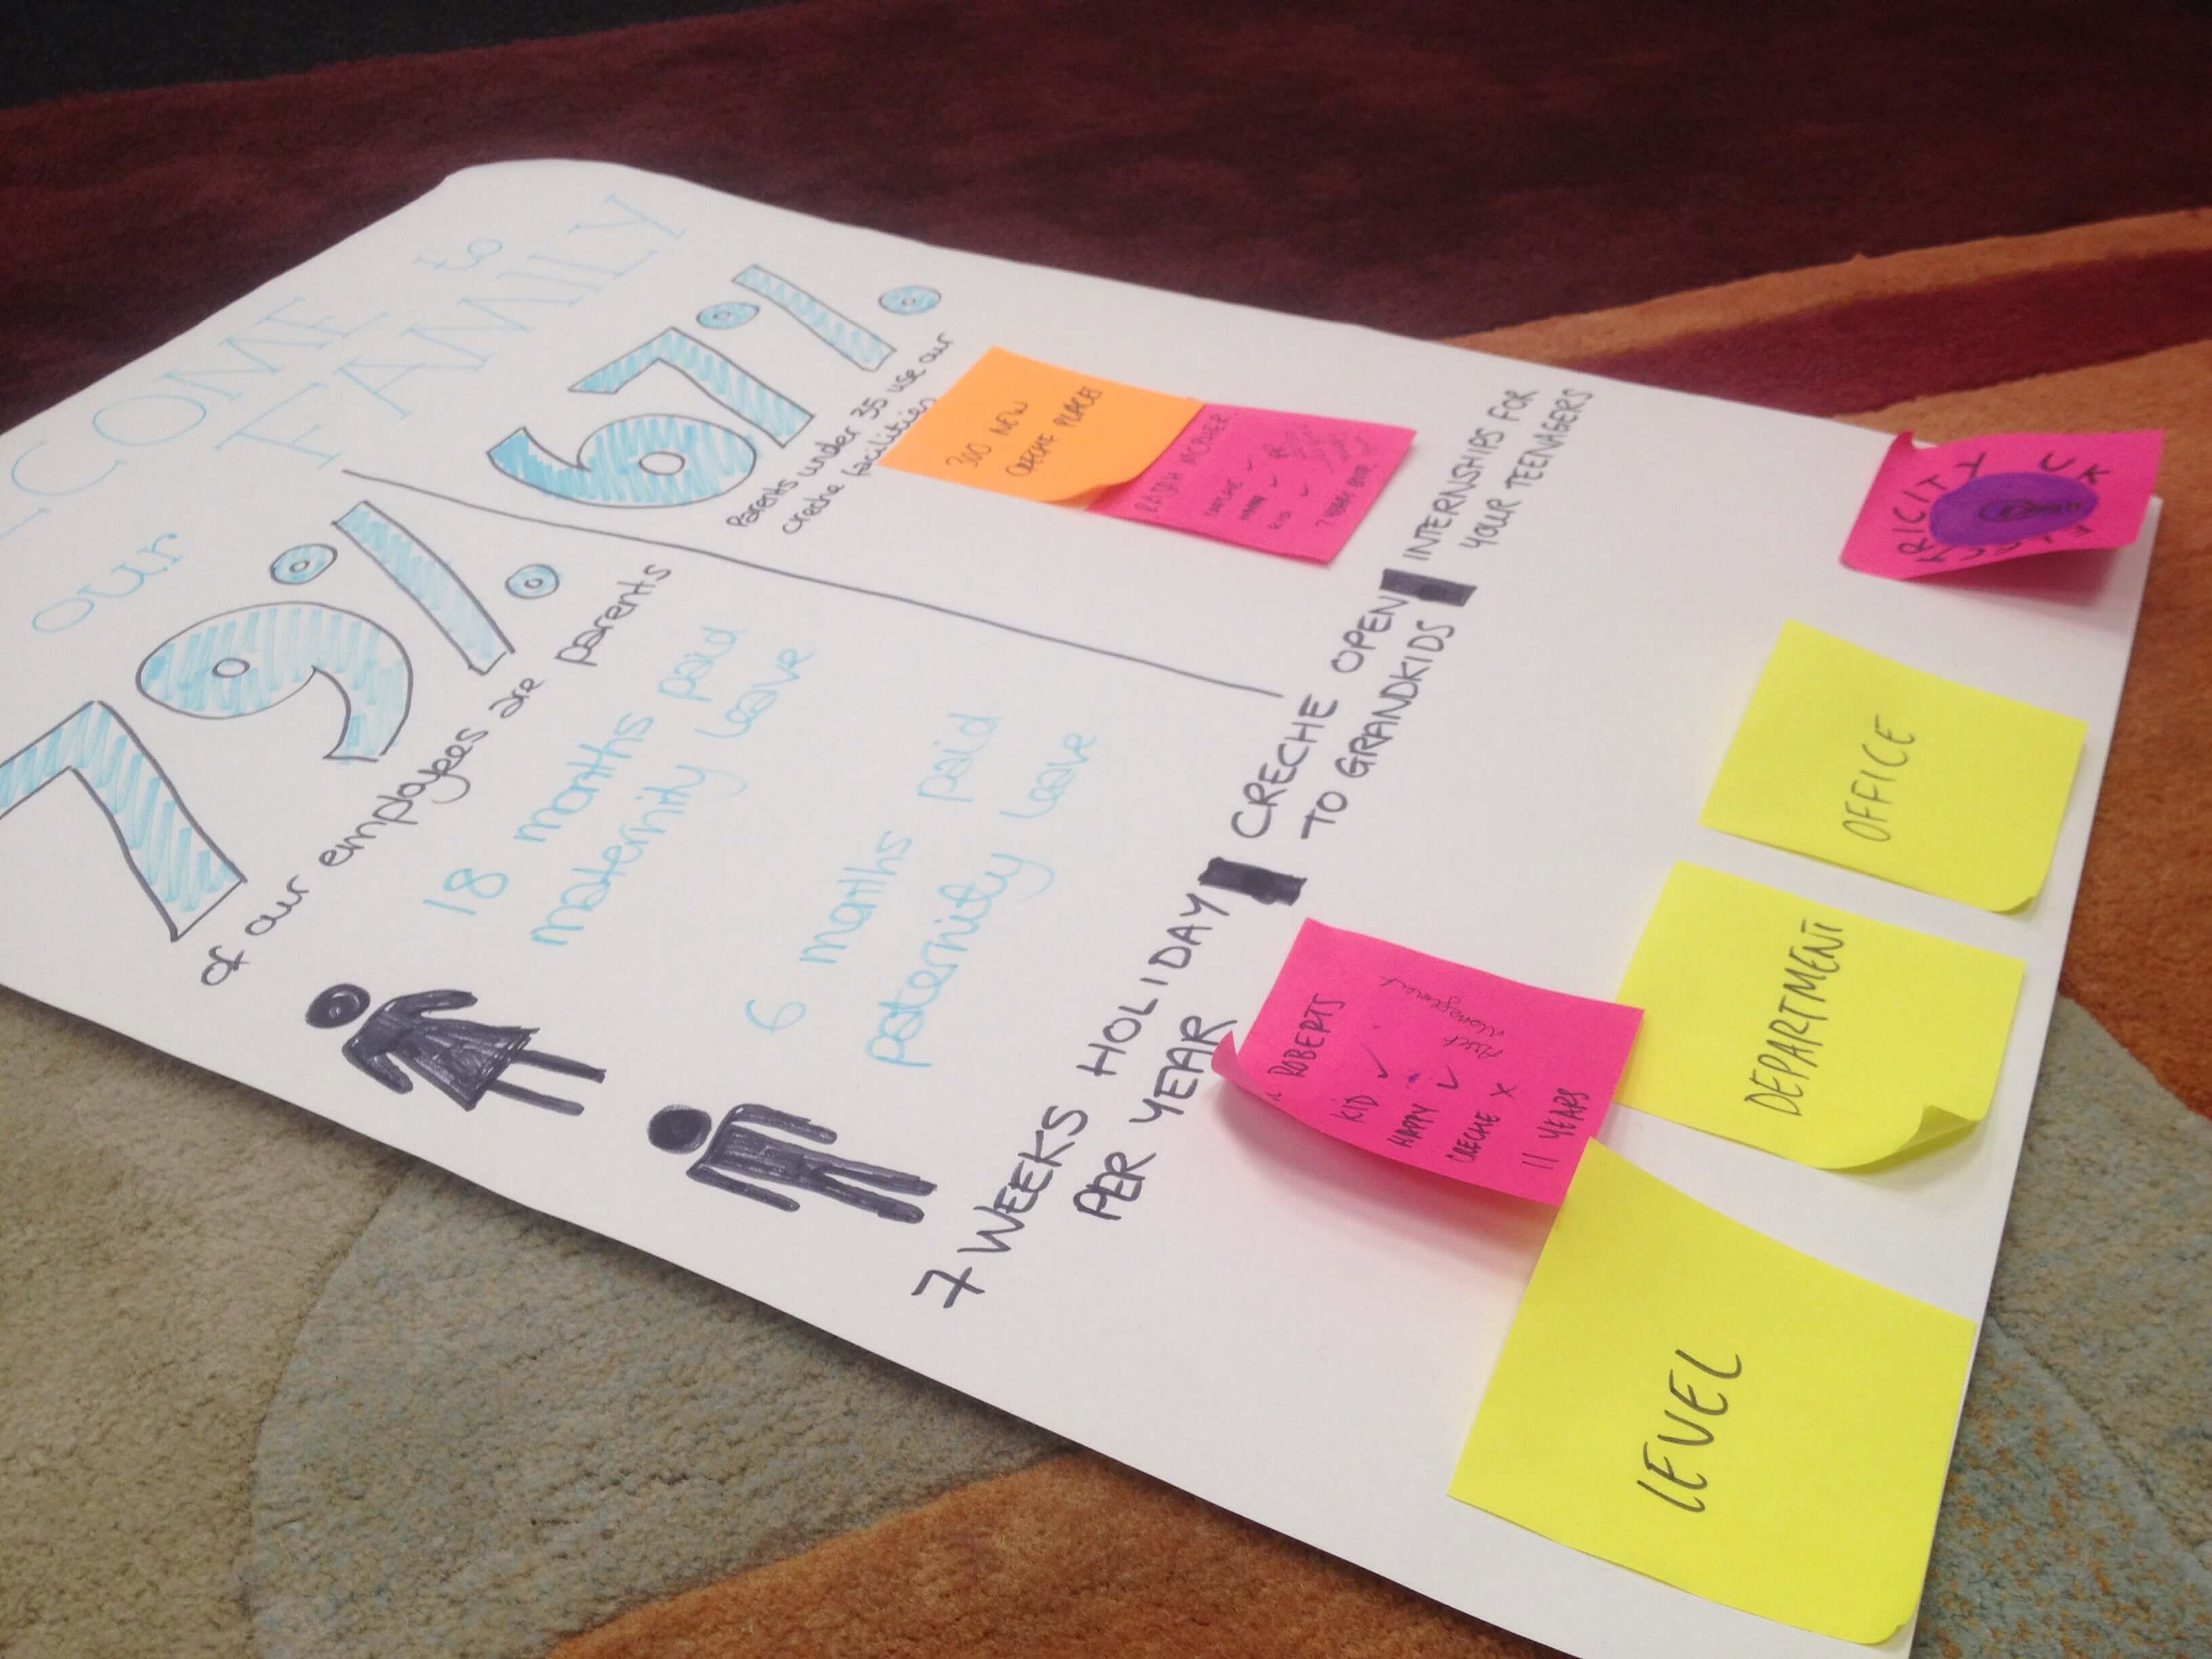 Still on paper now, and still no laptop, Tableau, Alteryx or any other software in sight. We wrote out the headers from the dataset onto post-it notes, decided which ones were appropriate and which weren’t, then stuck ’em on a huge piece of paper. The benefit of this is that you can move them around and decide which bit of information should go where. Once you’ve figured out pretty much what you are aiming for get out your felt-tips out and go full-on primary school kid. Draw out what sort of icons you might want to use. Draw massive numbers. Scrawl out the title or extra text you might want to include. PLAY! Designing infographics and dashboards is fun, you want your audience to engage fully so wake up that inner child of yours and access that imagination which you may have forgotten that you have.
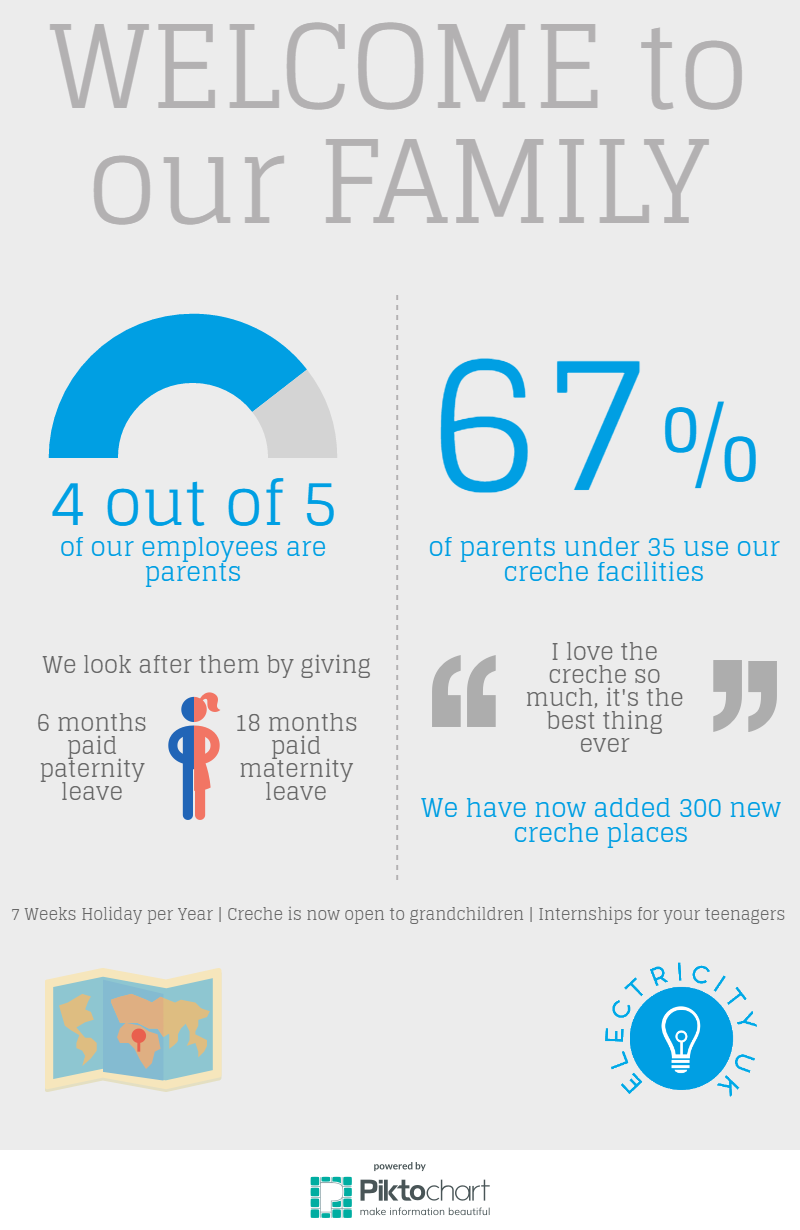 Okay so now it’s time to go to the laptop. In this instance we used online tool Piktochart to create an infographic. We made a very quick mock-up from our final big post-it note sketch and the image on the right is the result.
Voilà! You’ve taken spark of an idea, honed it, played with it and come up with a first draft of something relatively quickly. This is a great way of coming up with ideas without getting stuck down a rabbit hole too early on.
