When working with spatial data, you may sometimes want to show a path taken by something across your geographic domain. Tableau 2019.2 introduced a couple of new functions for exactly this purpose: Makepoint and Makeline.
To show how these can be used, I’m going to walk through an example using London Bus routes.
To start with you want your data in a very specific format, as outlined below:
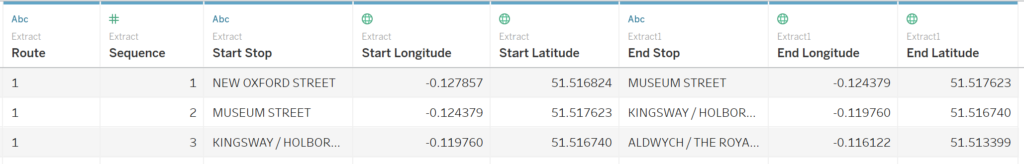
Route – name of the bus route.
Sequence – details the order of the bus stops on the route (e.g. Route 1 starts at New Oxford Street and next stops in Museum Street).
Start Stop/End stop – the start and end stop for each sequence on each route.
Start/End Longitude and Latitude – Geographic points for the start/end stop.
However, sometimes you may find a data-set like the following:
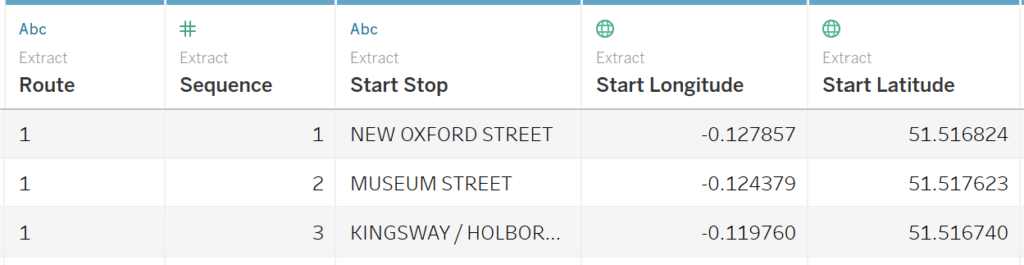
In which case, you need to prepare the data to include the end stop variables in each row (as before in the first example). You can do this in preparation software, but there’s also a neat little trick for doing it in Tableau:
1) Click and Drag your data-set, and place it next to itself to create a join.
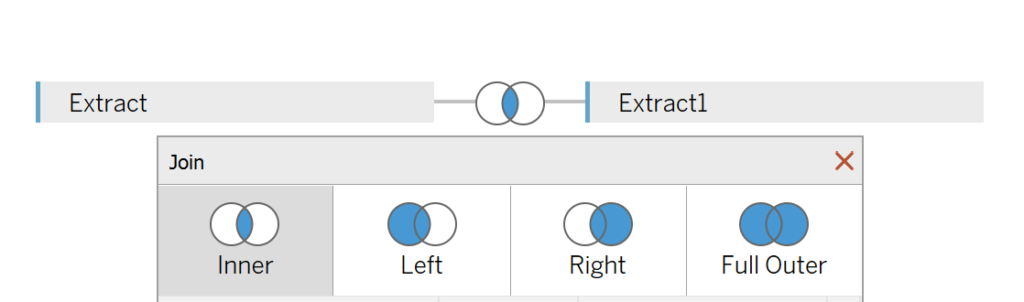
2) Select the inner join option, joining on Route and Sequence.
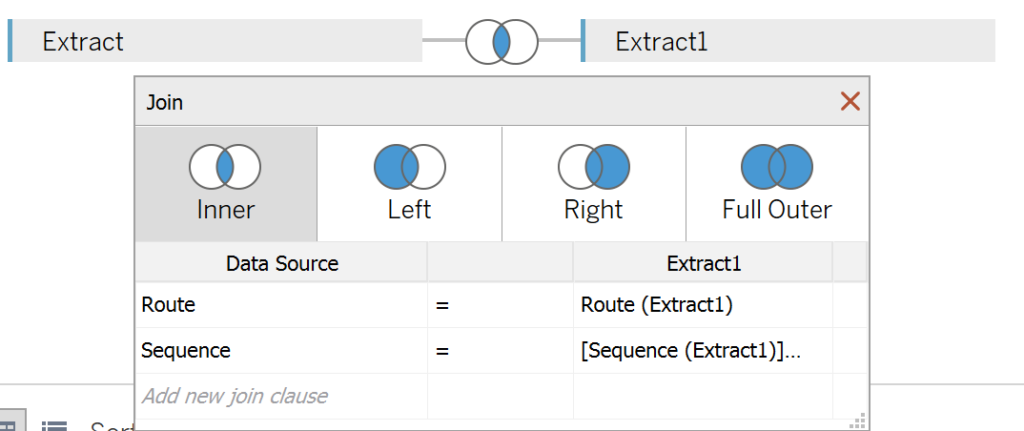
3) Change the right Extract Sequence join condition to “Edit Join Calculation”, and use the formula: “[Sequence (Extract1)]-1”.
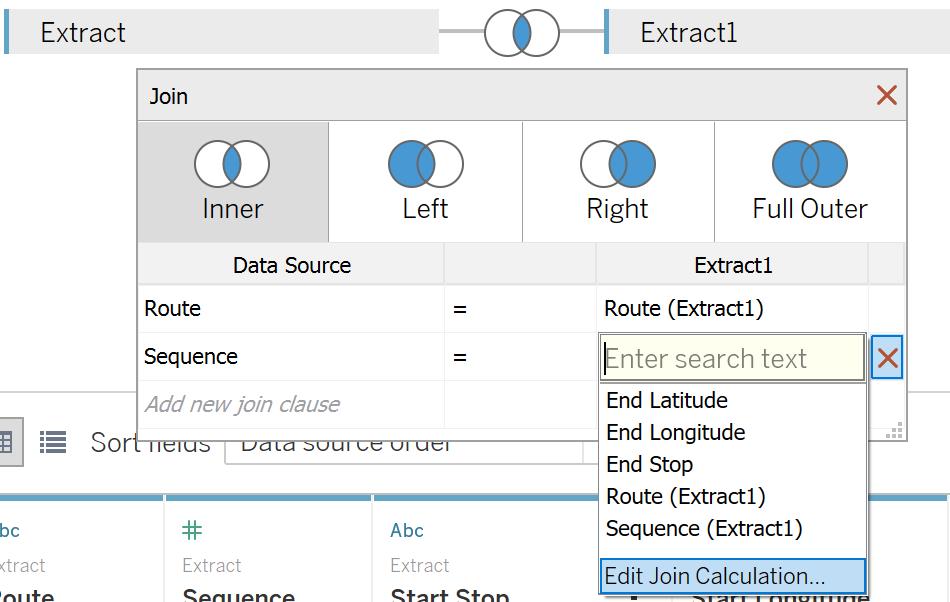
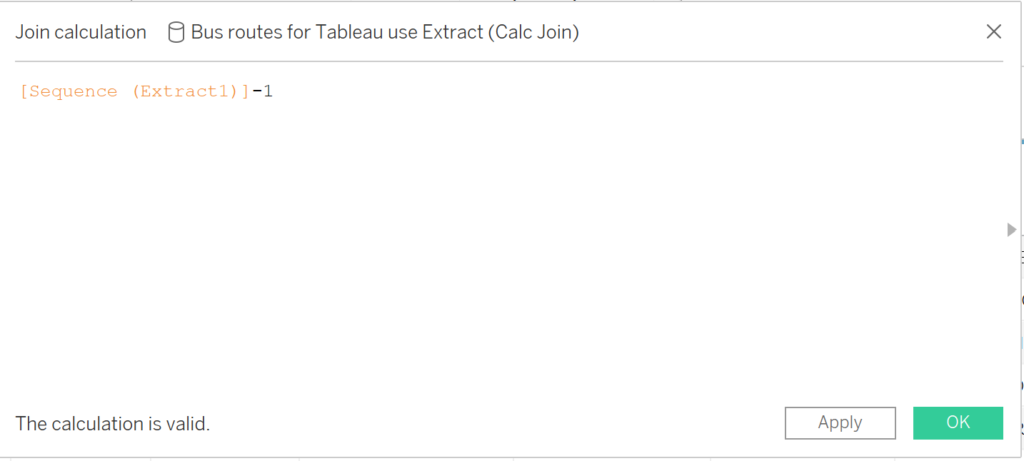
This reads the End stop name, Longitude and Latitude into each row, giving us the format we need!
Now we can create a new sheet, and make our lines.
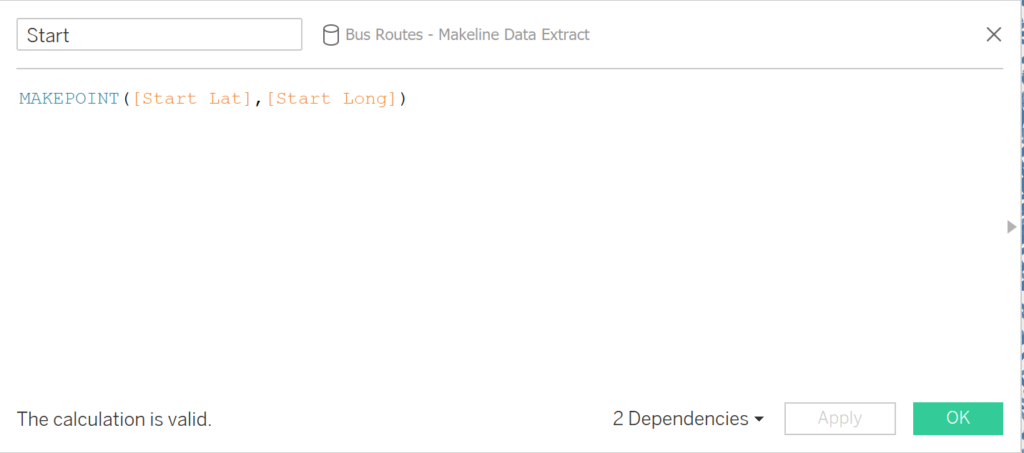
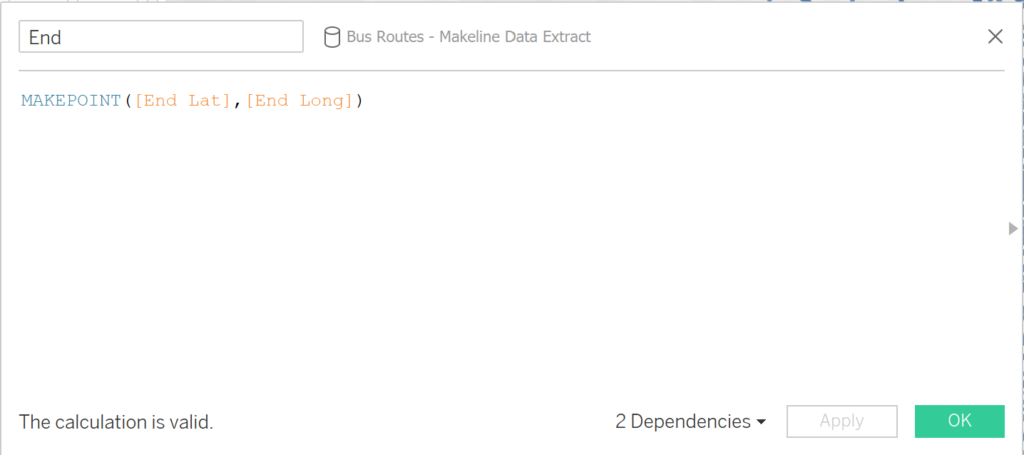
In order to create the lines for each route, we first need to create the points for each stop. This is where the new functions come in. Create 2 new calculated fields, for the start and end stops for each of the sequences on each route. Use the Makepoint function, entering the Lat and Long values into the parentheses (in that order!).
Once our points have been made, we can create our lines with another calculated field, using the Makeline function, entering in these points:
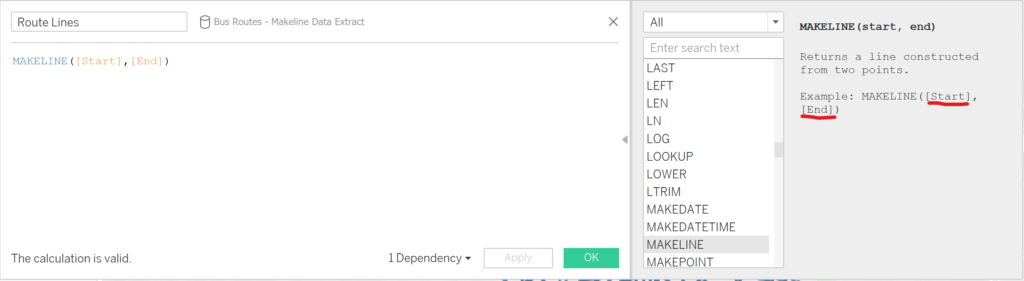
Double click on this new field to populate the view, and add route to detail to separate each route as a single mark in the view, and you’re done:
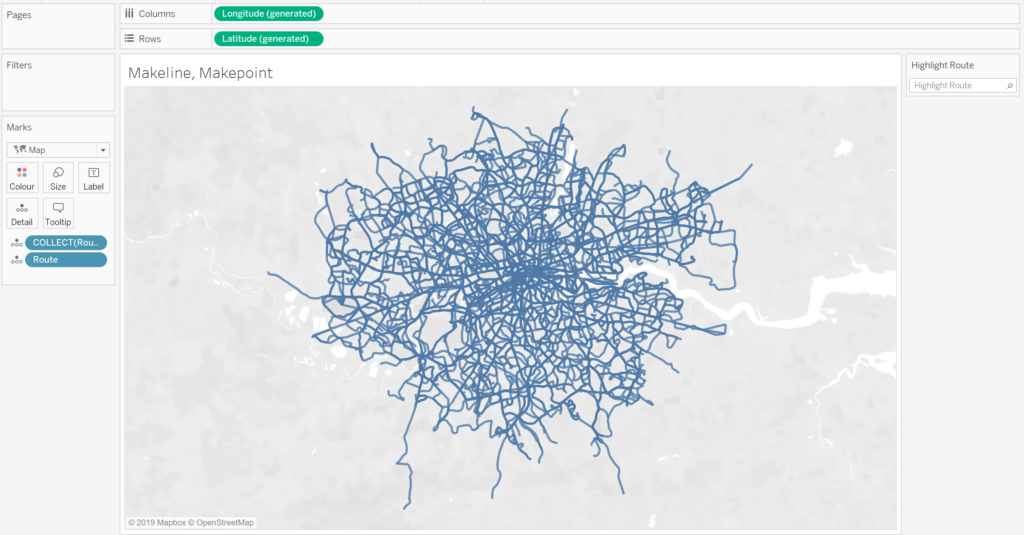
These functions, partnered with the new vector map options, introduce an abundance of possibilities for spatial analysis in Tableau, from personal tracking data (strava, runkeeper, etc.) to supply chain logistics.